
Mathematics
The daily wages of 160 workers in a factory are given below :
| Wages (in ₹) | No. of workers |
|---|---|
| 50-60 | 12 |
| 60-70 | 20 |
| 70-80 | 30 |
| 80-90 | 38 |
| 90-100 | 24 |
| 100-110 | 16 |
| 110-120 | 12 |
| 120-130 | 8 |
Draw a cumulative frequency curve and estimate :
(i) median wage
(ii) inter-quartile range
(iii) percentage of workers who earn more than ₹ 95 per day.
Statistics
2 Likes
Answer
Cumulative frequency distribution table :
| Wages (in ₹) | No. of workers | Cumulative frequency |
|---|---|---|
| 50-60 | 12 | 12 |
| 60-70 | 20 | 32 (20 + 12) |
| 70-80 | 30 | 62 (30 + 32) |
| 80-90 | 38 | 100 (38 + 62) |
| 90-100 | 24 | 124 (24 + 100) |
| 100-110 | 16 | 140 (16 + 124) |
| 110-120 | 12 | 152 (12 + 140) |
| 120-130 | 8 | 160 (8 + 152) |
(i) Here, n = 160, which is even.
By formula,
Median = = 80th term.
Steps of construction :
Take 2 cm along x-axis = 10 rupees.
Take 1 cm along y-axis = 20 workers.
Plot the point (50, 0) as ogive starts on x-axis representing lower limit of first class.
Plot the points (60, 12), (70, 32), (80, 62), (90, 100), (100, 124), (110, 140), (120, 152) and (130, 160).
Join the points by a free-hand curve.
Draw a line parallel to x-axis from point A (no. of workers) = 80, touching the graph at point F. From point F draw a line parallel to y-axis touching x-axis at point G.
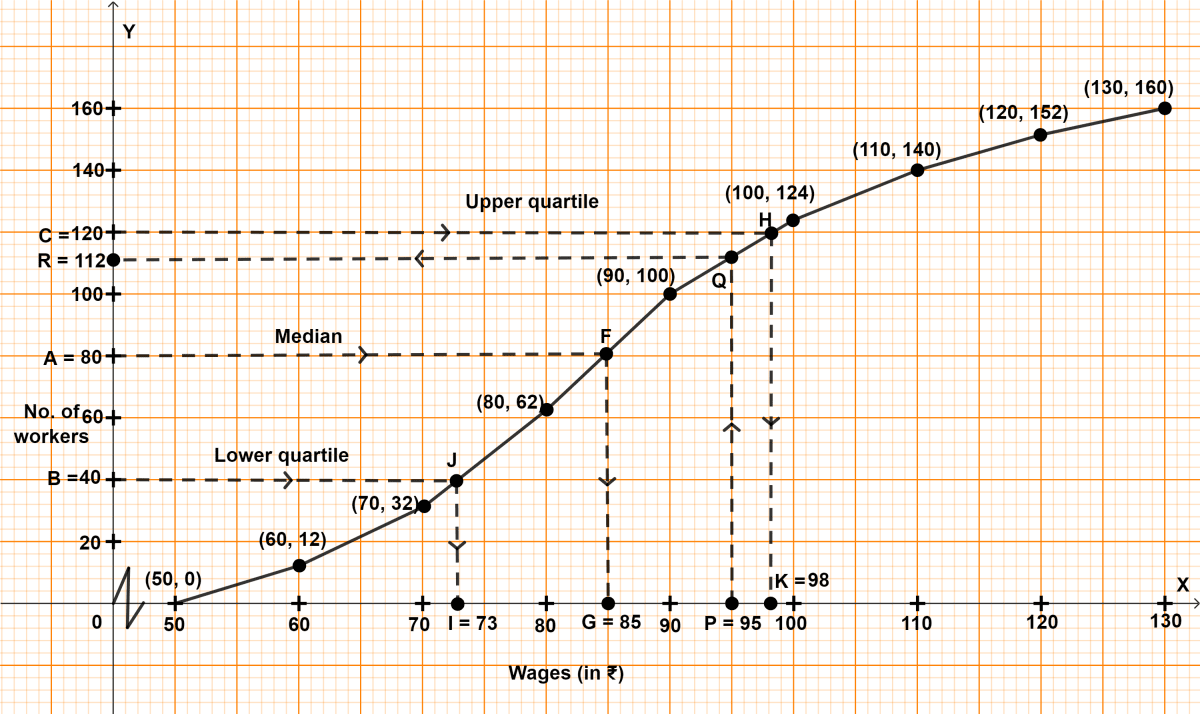
From graph, G = 85
Hence, median = 85.
(ii) Here, n is even.
Lower quartile = = 40th term.
Draw a line parallel to x-axis from point B (no. of workers) = 40, touching the graph at point J. From point J draw a line parallel to y-axis touching x-axis at point I.
From graph, I = 73
Lower quartile = 73.
Upper quartile = = 120th term.
Draw a line parallel to x-axis from point C (no. of workers) = 120, touching the graph at point H. From point H draw a line parallel to y-axis touching x-axis at point K.
From graph, K = 98
Upper quartile = 98.
Inter quartile range = Upper quartile - Lower quartile
= 98 - 73 = 25.
Hence, inter-quartile range = 25.
(iii) Draw a line parallel to y-axis from point P (wage) = ₹ 95, touching the graph at point Q. From point Q draw a line parallel to x-axis touching y-axis at point R.
From graph, R = 112
∴ 112 workers earn less or equal to ₹ 95.
Workers earning more = 160 - 112 = 48.
Percentage of workers earning more = = 30%.
Hence, 30% of workers earn more than ₹ 95.
Answered By
2 Likes
Related Questions
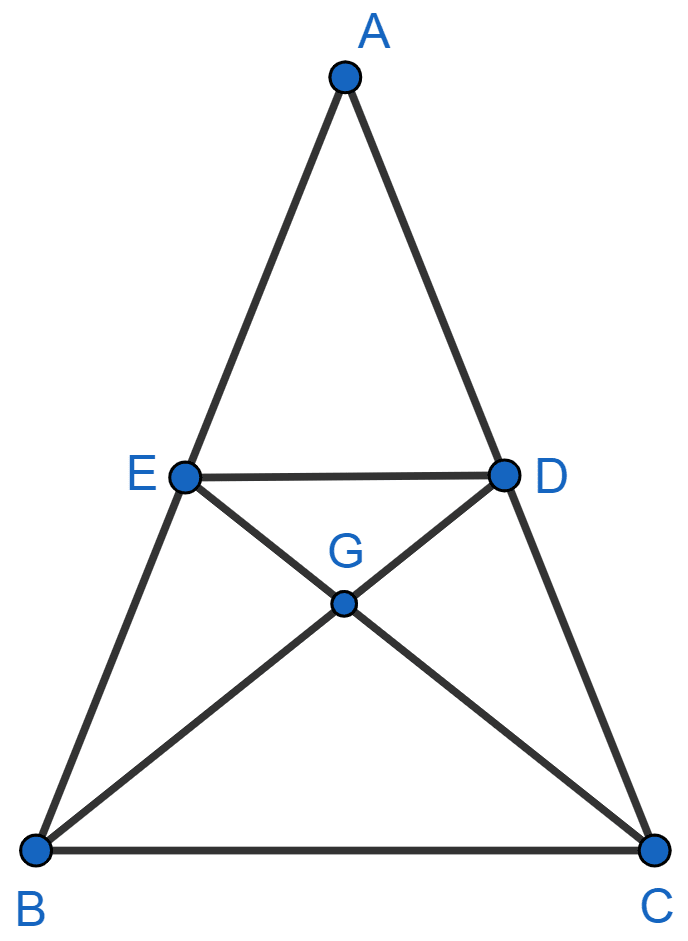
In the given figure, the median BD and CE of triangle ABC meet at point G. Show that BG = 2GD.
The sides of a right-angled triangle, containing the right angle, are 3(x + 1) cm and (2x - 1) cm. If the area of the triangle is 30 cm2, find the lengths of the sides of the triangle.
Solve for x : .
Construct a triangle PQR, in which PR = 6 cm ad PQ = QR = 6.8 cm.
(i) Mark S the mid-point of PQ.
(ii) Construct the circle which touches QR at R and passes through S.