Chemistry
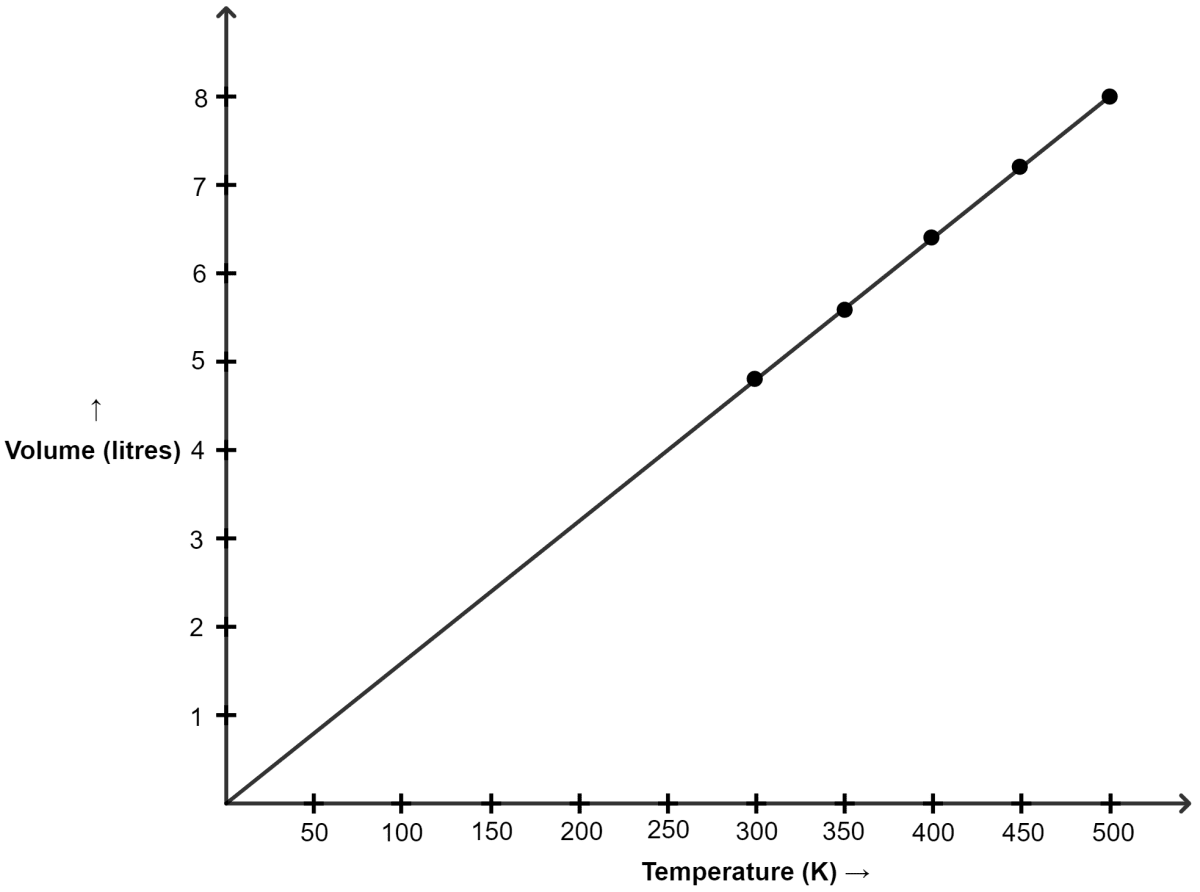
Plot V versus absolute T (K) by the given data:
| Temperature | Volume in litres |
|---|---|
| 27°C | 4.8 |
| 77°C | 5.6 |
| 127°C | 6.4 |
| 177°C | 7.2 |
| 227°C | 8.0 |
(a) The graph between V and T is a …………… .
(b) Check whether the line passes through the origin.
(c) Which law is obeyed.
Answer
Converting temperature to Kelvin Scale :
| Temp (°C) | Temp (K) | Volume (litres) |
|---|---|---|
| 27 | 300 | 4.8 |
| 77 | 350 | 5.6 |
| 127 | 400 | 6.4 |
| 177 | 450 | 7.2 |
| 227 | 500 | 8.0 |
Graph of V versus absolute T is shown below :

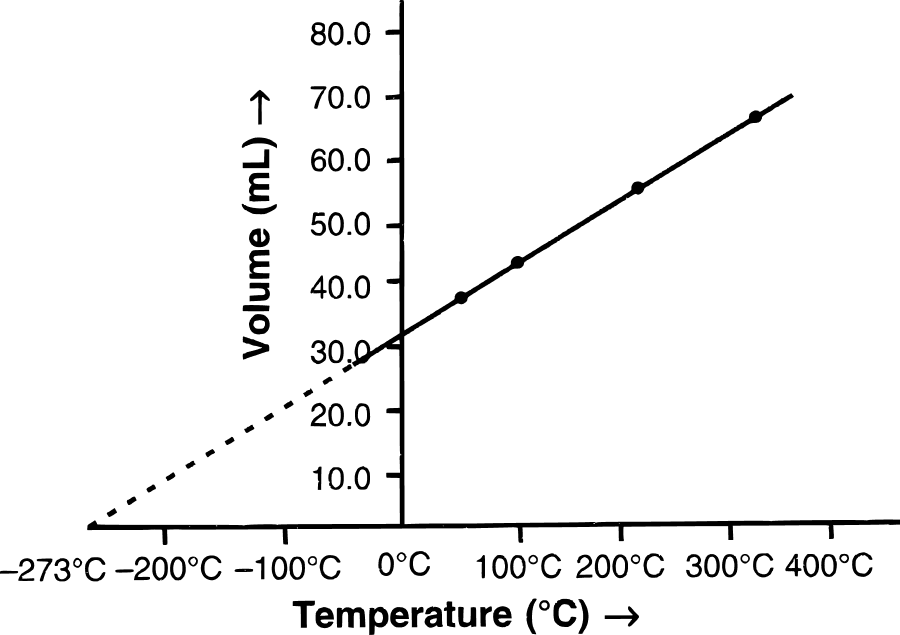
(a) The graph between V and T is a straight line.
(b) Yes, as we can see in the graph, the line passes through the origin.
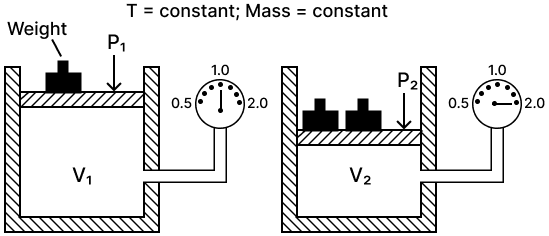
(c) Charles' law

