
Chemistry
Plot V versus absolute T (K) by the given data:
| Temperature | Volume in litres |
|---|---|
| 27°C | 4.8 |
| 77°C | 5.6 |
| 127°C | 6.4 |
| 177°C | 7.2 |
| 227°C | 8.0 |
(a) The graph between V and T is a …………… .
(b) Check whether the line passes through the origin.
(c) Which law is obeyed.
Gas Laws
33 Likes
Answer
Converting temperature to Kelvin Scale :
| Temp (°C) | Temp (K) | Volume (litres) |
|---|---|---|
| 27 | 300 | 4.8 |
| 77 | 350 | 5.6 |
| 127 | 400 | 6.4 |
| 177 | 450 | 7.2 |
| 227 | 500 | 8.0 |
Graph of V versus absolute T is shown below :
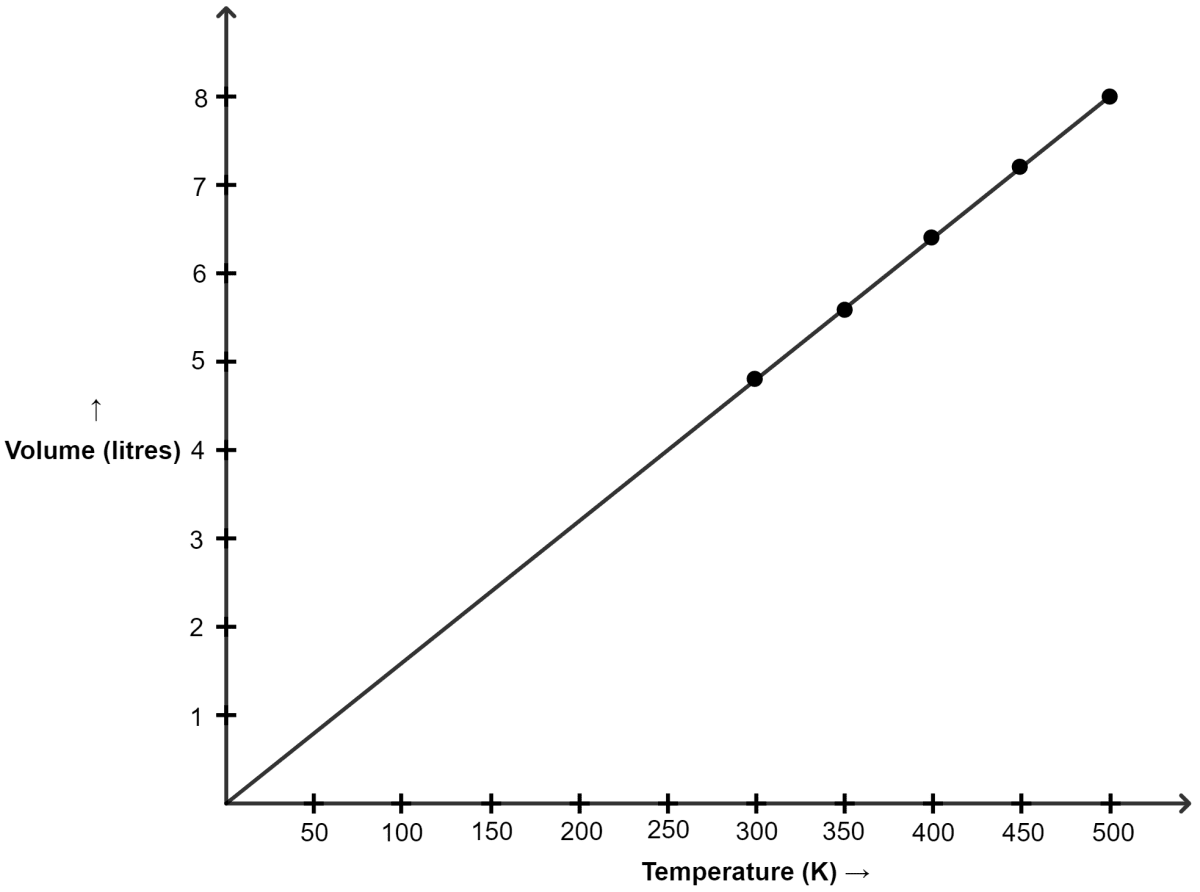
(a) The graph between V and T is a straight line.
(b) Yes, as we can see in the graph, the line passes through the origin.
(c) Charles' law
Answered By
27 Likes
Related Questions
(a) State the law verified by the following figure:
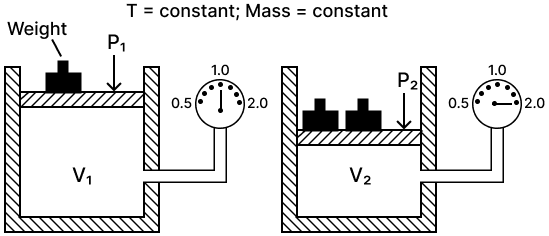
(b) Draw P.V. isothermal for the above law.
(a) State the law which the following graph verifies.
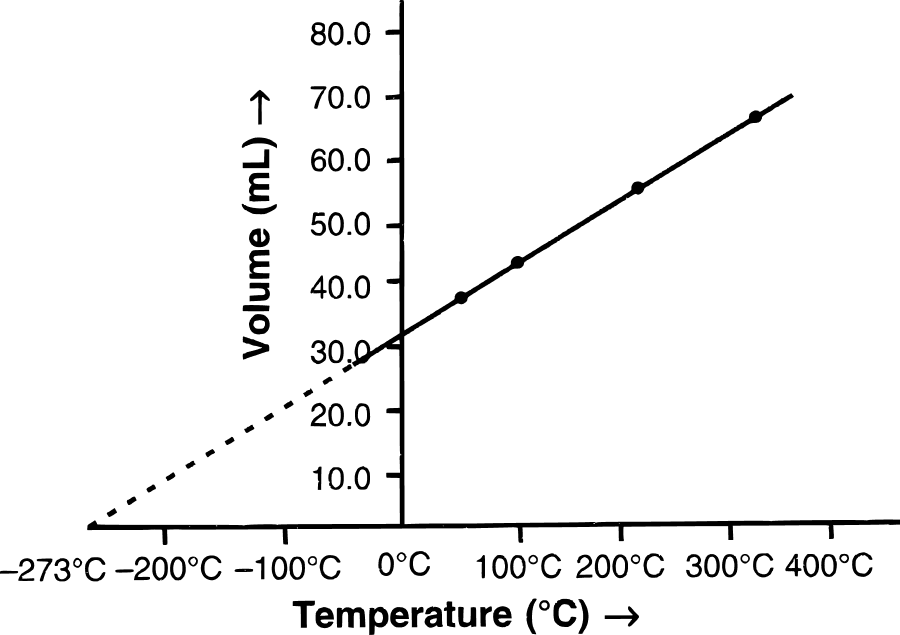
(b) Derive the mathematical expression for it.
(c) Give one application/use where the above law is employed.
Convert :
(i) 273°C to kelvin
(ii) 293 K to °C
800 cm3 of gas is collected at 654 mm pressure. At what pressure would the volume of the gas reduce by 40% of its original volume, temperature remaining constant?