Mathematics
The marks of 200 students are as given below :
| Marks | No. of students |
|---|---|
| 20-29 | 7 |
| 30-39 | 11 |
| 40-49 | 20 |
| 50-59 | 46 |
| 60-69 | 57 |
| 70-79 | 37 |
| 80-89 | 15 |
| 90-99 | 7 |
Draw a cumulative frequency curve and find :
(i) median marks
(ii) if 80% of the students passed, find the passing marks.
Statistics
2 Likes
Answer
The above distribution is discontinuous converting into continuous distribution, we get :
Adjustment factor = (Lower limit of one class - Upper limit of previous class) / 2
=
= 0.5
Subtract the adjustment factor (0.5) from all the lower limits and add the adjustment factor (0.5) to all the upper limits.
Cumulative frequency distribution table is as follows :
| Marks | No. of students | Cumulative frequency |
|---|---|---|
| 19.5-29.5 | 7 | 7 |
| 29.5-39.5 | 11 | 18 (7 + 11) |
| 39.5-49.5 | 20 | 38 (18 + 20) |
| 49.5-59.5 | 46 | 84 (38 + 46) |
| 59.5-69.5 | 57 | 141 (84 + 57) |
| 69.5-79.5 | 37 | 178 (141 + 37) |
| 79.5-89.5 | 15 | 193 (178 + 15) |
| 89.5-99.5 | 7 | 200 (193 + 7) |
(i) Here, n = 200, which is even.
By formula,
Median = = 100th term.
Steps of construction :
Take 2 cm along x-axis = 10 marks.
Take 1 cm along y-axis = 20 students.
Plot the point (19.5, 0) as ogive starts on x-axis representing lower limit of first class.
Plot the points (29.5, 7), (39.5, 18), (49.5, 38), (59.5, 84), (69.5, 141), (79.5, 178), (89.5, 193) and (99.5, 200).
Join the points by a free-hand curve.
Draw a line parallel to x-axis from point A (no. of students) = 100, touching the graph at point B. From point B draw a line parallel to y-axis touching x-axis at point C.
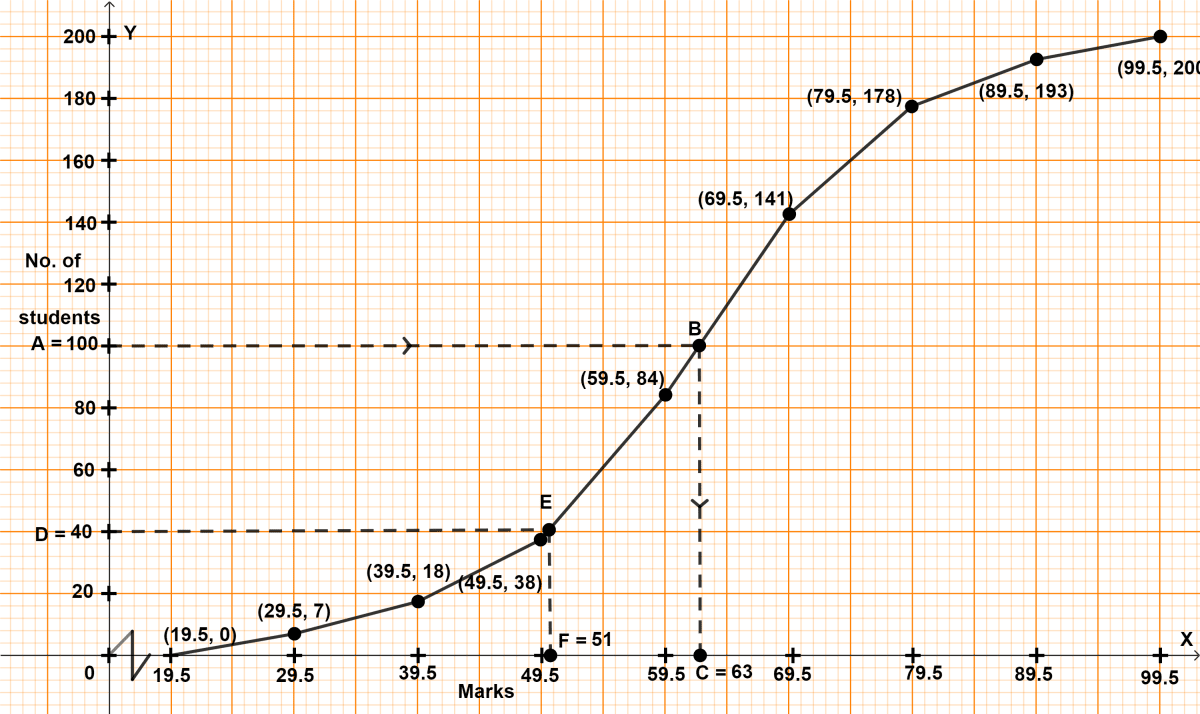
From graph, C = 63
Hence, median = 63.
(ii) Given,
80% of students pass the exam or 20% students fail the exam.
.
40 students fail the exam.
Draw a line parallel to x-axis from point D (no. of students) = 40, touching the graph at point E. From point E draw a line parallel to y-axis touching x-axis at point F.
From graph, F = 51
∴ 40 students score less than 51 marks.
Hence, passing marks = 51.
Answered By
3 Likes
Related Questions
Using ruler and compasses only construct
(i) a triangle ABC in which angle ABC = 45°, AB = 8.6 cm and BC = 9.8 cm
(ii) construct a circle of radius 2.5 cm which touches the arms of the angle BAC of △ABC given above.
If two pipes function simultaneously, the reservoir will be filled in 12 hours. One pipe fills the empty reservoir 10 hours faster than the other. How many hours does it take the second pipe to fill the reservoir ?
Solve for x : .
In the given figure, . Find AB if DC = 24 cm.