Mathematics
The marks obtained (out of 100) by 400 students in an examination are given below :
| Marks | No. of students |
|---|---|
| 0-10 | 10 |
| 10-20 | 20 |
| 20-30 | 22 |
| 30-40 | 40 |
| 40-50 | 54 |
| 50-60 | 76 |
| 60-70 | 80 |
| 70-80 | 58 |
| 80-90 | 28 |
| 90-100 | 12 |
Using a graph paper, draw an ogive for the above distribution. Use your graph to estimate :
(i) the median marks.
(ii) the number of students who obtained more than 80% marks in the examination.
(iii) the number of students who did not pass, if the pass percentage was 35.
Related Questions
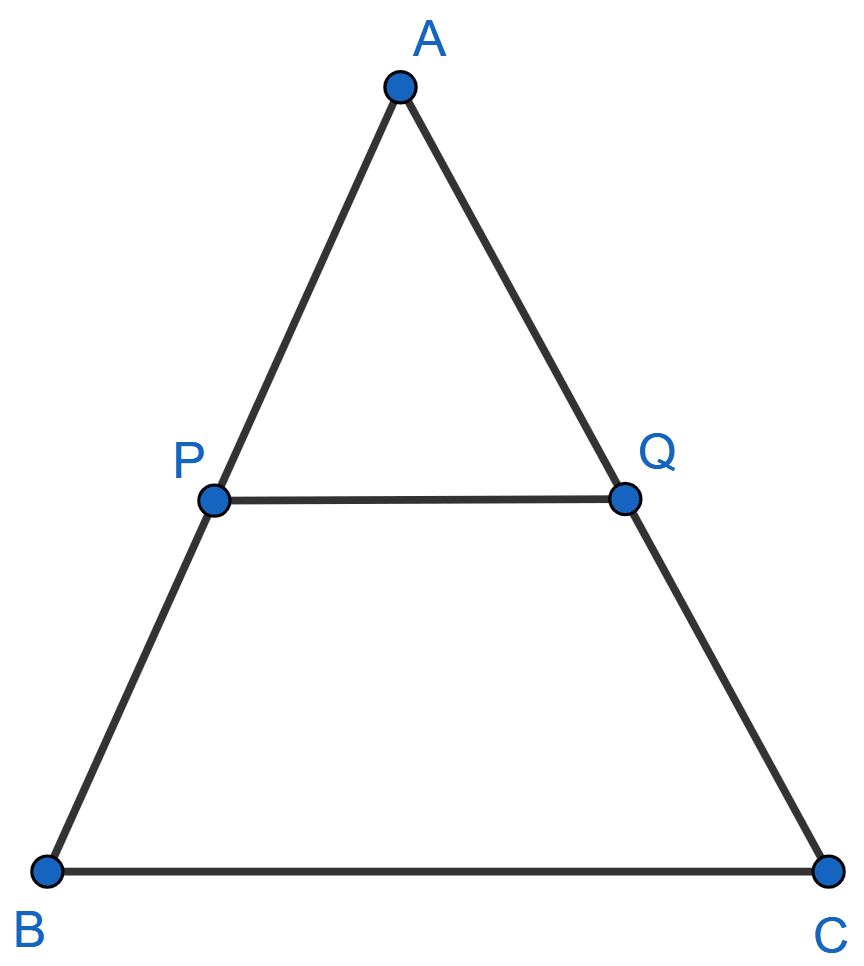
P and Q are points on the sides AB and AC of triangle ABC. If AP = 3 cm, PB = 6 cm, AQ = 4.5 cm and QC = 9 cm, show that BC = 3 × PQ.

Construct a regular hexagon of side 3 cm. Draw its circumcircle and measure its circumradius.
The speed of a boat in still water is 11 km per hour. It can go 12 km upstream and return downstream to the original point in 2 hours and 45 minutes. Find the speed of stream.