Mathematics
The marks obtained (out of 100) by 400 students in an examination are given below :
| Marks | No. of students |
|---|---|
| 0-10 | 10 |
| 10-20 | 20 |
| 20-30 | 22 |
| 30-40 | 40 |
| 40-50 | 54 |
| 50-60 | 76 |
| 60-70 | 80 |
| 70-80 | 58 |
| 80-90 | 28 |
| 90-100 | 12 |
Using a graph paper, draw an ogive for the above distribution. Use your graph to estimate :
(i) the median marks.
(ii) the number of students who obtained more than 80% marks in the examination.
(iii) the number of students who did not pass, if the pass percentage was 35.
Statistics
3 Likes
Answer
Cumulative frequency distribution table :
| Marks | No. of students | Cumualtive frequency |
|---|---|---|
| 0-10 | 10 | 10 |
| 10-20 | 20 | 30 (10 + 20) |
| 20-30 | 22 | 52 (30 + 22) |
| 30-40 | 40 | 92 (52 + 40) |
| 40-50 | 54 | 146 (92 + 54) |
| 50-60 | 76 | 222 (146 + 76) |
| 60-70 | 80 | 302 (222 + 80) |
| 70-80 | 58 | 360 (302 + 58) |
| 80-90 | 28 | 388 (360 + 28) |
| 90-100 | 12 | 400 (388 + 12) |
(i) Here, n = 400, which is even.
By formula,
Median = th term
= = 200th term.
Steps of construction :
Take 1 cm along x-axis = 10 marks.
Take 1 cm along y-axis = 50 students.
Plot the point (0, 0) as ogive starts on x-axis representing lower limit of first class.
Plot the points (10, 10), (20, 30), (30, 52), (40, 92), (50, 146), (60, 222), (70, 302), (80, 360), (90, 388) and (100, 400).
Join the points by a free-hand curve.
Draw a line parallel to x-axis from point A (no. of students) = 200, touching the graph at point B. From point B draw a line parallel to y-axis touching x-axis at point C.

From graph, C = 58
Hence, median = 58.
(ii) Total marks = 100.
80% marks = = 80.
Draw a line parallel to y-axis from point D(marks) = 80, touching the graph at point E. From point E draw a line parallel to x-axis touching y-axis at point F.
From graph, F = 360.
∴ 360 students score less than or equal to 80%.
Students scoring above than 80% = 400 - 360 = 40.
Hence, 40 students score more than 80%.
(iii) Total marks = 100.
35% marks = = 35.
Draw a line parallel to y-axis from point G(marks) = 35, touching the graph at point H. From point H draw a line parallel to x-axis touching y-axis at point I.
From graph, I = 72.
∴ 72 students score less than or equal to 35%.
Hence, 72 students failed the test.
Answered By
2 Likes
Related Questions
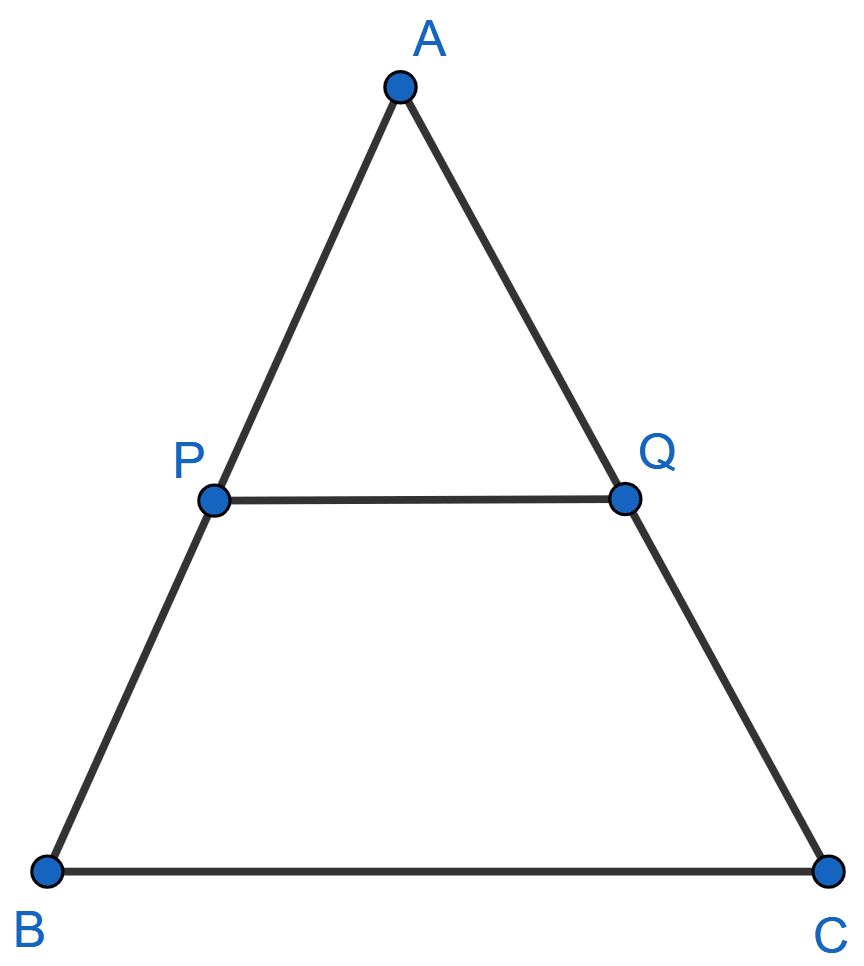
P and Q are points on the sides AB and AC of triangle ABC. If AP = 3 cm, PB = 6 cm, AQ = 4.5 cm and QC = 9 cm, show that BC = 3 × PQ.

The speed of a boat in still water is 11 km per hour. It can go 12 km upstream and return downstream to the original point in 2 hours and 45 minutes. Find the speed of stream.
If , prove that :
(i) a : b = c : d
(ii)
Construct a regular hexagon of side 3 cm. Draw its circumcircle and measure its circumradius.