Mathematics
For the following frequency distribution, draw an ogive and then use it to estimate the median.
| C.I. | f |
|---|---|
| 450 - 550 | 40 |
| 550 - 650 | 68 |
| 650 - 750 | 86 |
| 750 - 850 | 120 |
| 850 - 950 | 90 |
| 950 - 1050 | 40 |
| 1050 - 1150 | 6 |
For the same distribution, as given above, draw a histogram and then use it to estimate the mode.
Statistics
5 Likes
Answer
Cumulative frequency distribution table is as follows :
| C.I. | f | Cumulative frequency |
|---|---|---|
| 450 - 550 | 40 | 40 |
| 550 - 650 | 68 | 108 (40 + 68) |
| 650 - 750 | 86 | 194 (108 + 86) |
| 750 - 850 | 120 | 314 (194 + 120) |
| 850 - 950 | 90 | 404 (314 + 90) |
| 950 - 1050 | 40 | 444 (404 + 40) |
| 1050 - 1150 | 6 | 450 (444 + 6) |
Here no. of terms = 450, which is even.
By formula,
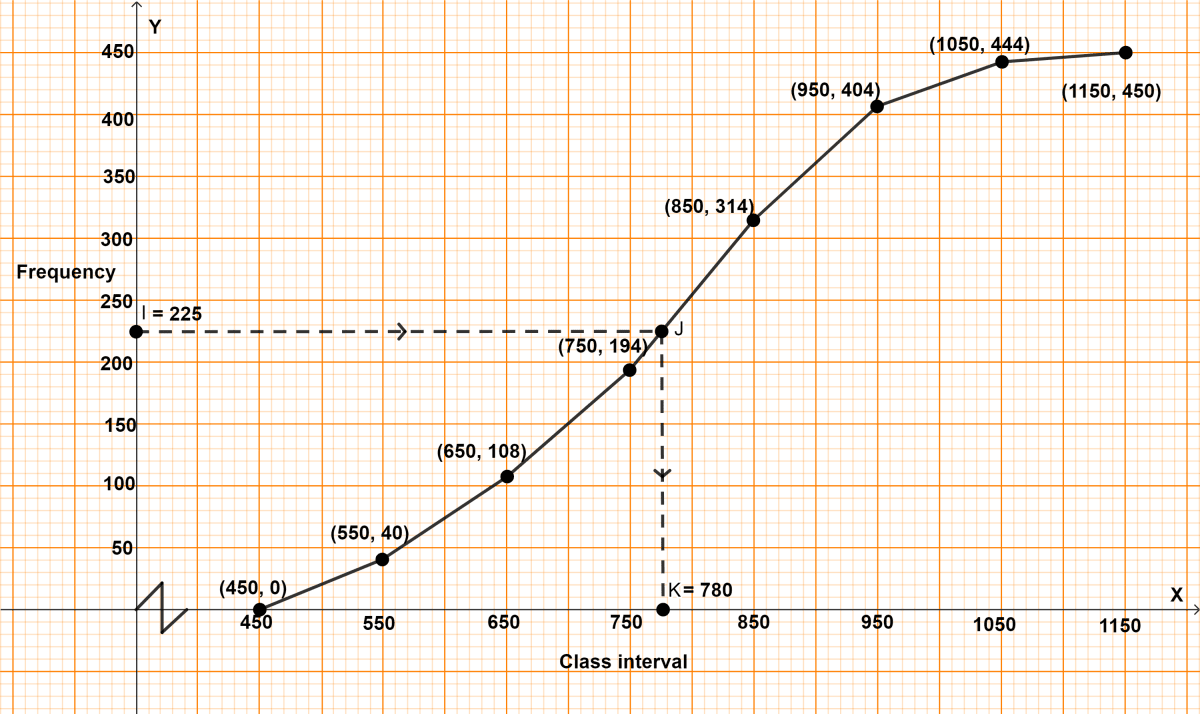
Median = th term = 225.
Steps of construction of ogive :
Take 2 cm = 100 units (C.I.) on x-axis.
Take 1 cm = 50 units (frequency) on y-axis.
A kink is shown near x-axis as it starts from 450. Plot the point (450, 0) as ogive starts on x-axis representing lower limit of first class.
Plot the points (550, 40), (650, 108), (750, 194), (850, 314), (950, 404), (1050, 444) and (1150, 450).
Join the points by a free-hand curve.
Draw a line parallel to x-axis from point I (frequency) = 225, touching the graph at point J. From point J draw a line parallel to y-axis touching x-axis at point K.

From graph, K = 780
Hence, median = 780.
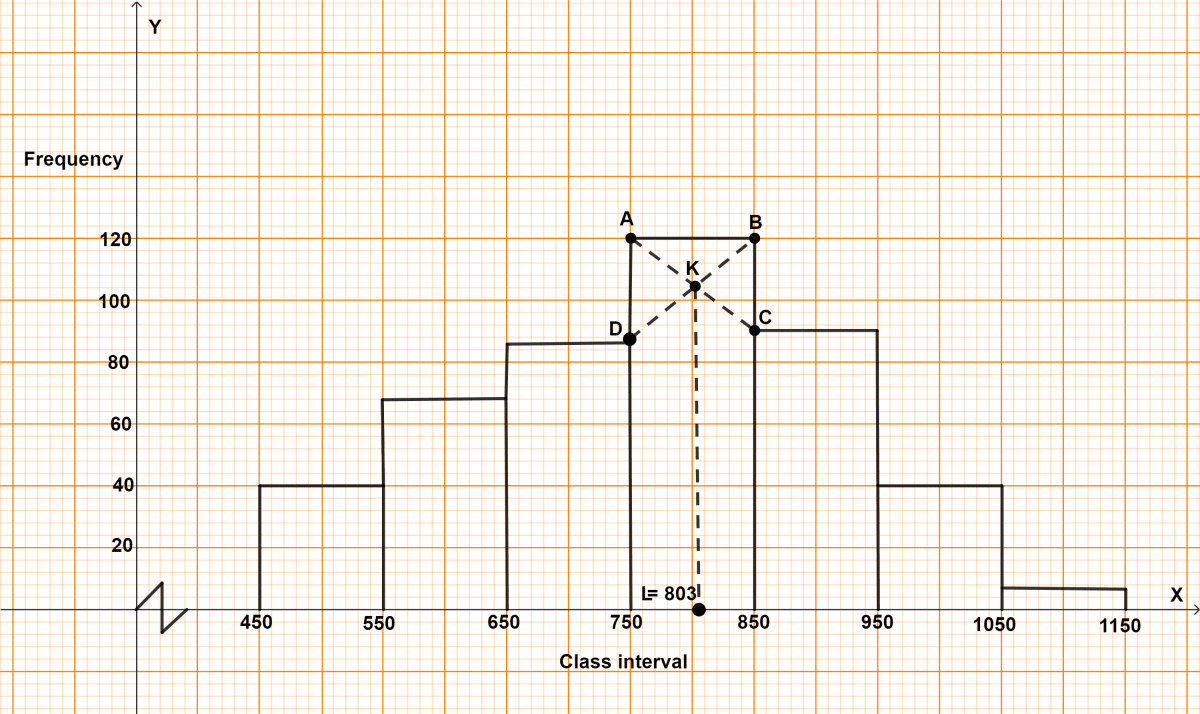
Steps :
Draw a histogram of the given distribution.
Inside the highest rectangle, which represents the maximum frequency (or modal class), draw two lines AC and BD diagonally from the upper corners A and B of adjacent rectangles.
Through point K (the point of intersection of diagonals AC and BD), draw KL perpendicular to the horizontal axis.
The value of point L on the horizontal axis represents the value of mode.
∴ Mode = 803.

Hence, mode = 803.
Answered By
2 Likes
Related Questions
Solve for x, 0° ≤ x ≤ 90°
(i) 4 cos2 2x - 3 = 0
(ii) 2 sin2 x - sin x = 0
A ladder rests against a wall at an angle α to the horizontal. Its foot is pulled away from the wall through a distance a, so that it slides a distance b down the wall making an angle β with the horizontal. Show that :
Find the probability of drawing an ace or a jack from a pack of 52 cards.
A bag contains 5 red balls and some blue balls. If the probability of drawing a blue ball is double that of red ball, find the number of blue balls in the bag.