
Mathematics
In a school, 100 pupils have heights as tabulated below :
| Height (in cm) | No. of pupils |
|---|---|
| 121 - 130 | 12 |
| 131 - 140 | 16 |
| 141 - 150 | 30 |
| 151 - 160 | 20 |
| 161 - 170 | 14 |
| 171 - 180 | 8 |
Find the median height by drawing an ogive.
Measures of Central Tendency
16 Likes
Answer
The above distribution is discontinuous, converting into continuous distribution, we get :
Adjustment factor = (Lower limit of one class - Upper limit of previous class) / 2
=
= 0.5
Subtract the adjustment factor (0.5) from all the lower limits and add the adjustment factor (0.5) to all the upper limits.
| Classes before adjustment | Classes after adjustment | No. of pupils | Cumulative frequency |
|---|---|---|---|
| 121 - 130 | 120.5 - 130.5 | 12 | 12 |
| 131 - 140 | 130.5 - 140.5 | 16 | 28 (12 + 16) |
| 141 - 150 | 140.5 - 150.5 | 30 | 58 (28 + 30) |
| 151 - 160 | 150.5 - 160.5 | 20 | 78 (58 + 20) |
| 161 - 170 | 160.5 - 170.5 | 14 | 92 (78 + 14) |
| 171 - 180 | 170.5 - 180.5 | 8 | 100 (92 + 8) |
Here, n = 100 which is even.
By formula,
Median = = 50th term.
Steps of construction of ogive :
Since, the scale on x-axis starts at 120.5, a break (kink) is shown near the origin on x-axis to indicate that the graph is drawn to scale beginning at 120.5.
Take 2 cm along x-axis = 10 units.
Take 1 cm along y-axis = 10 units.
Plot the point (120.5, 0), as ogive always starts on x-axis representing the lower limit of the first class.
Plot the points (130.5, 12), (140.5, 28), (150.5, 58), (160.5, 78), (170.5, 92) and (180.5, 100).
Join the points by a free hand curve.
Draw a line parallel to x-axis from point A (frequency) = 50, touching the graph at point B. From point B draw a line parallel to y-axis touching x-axis at point C.
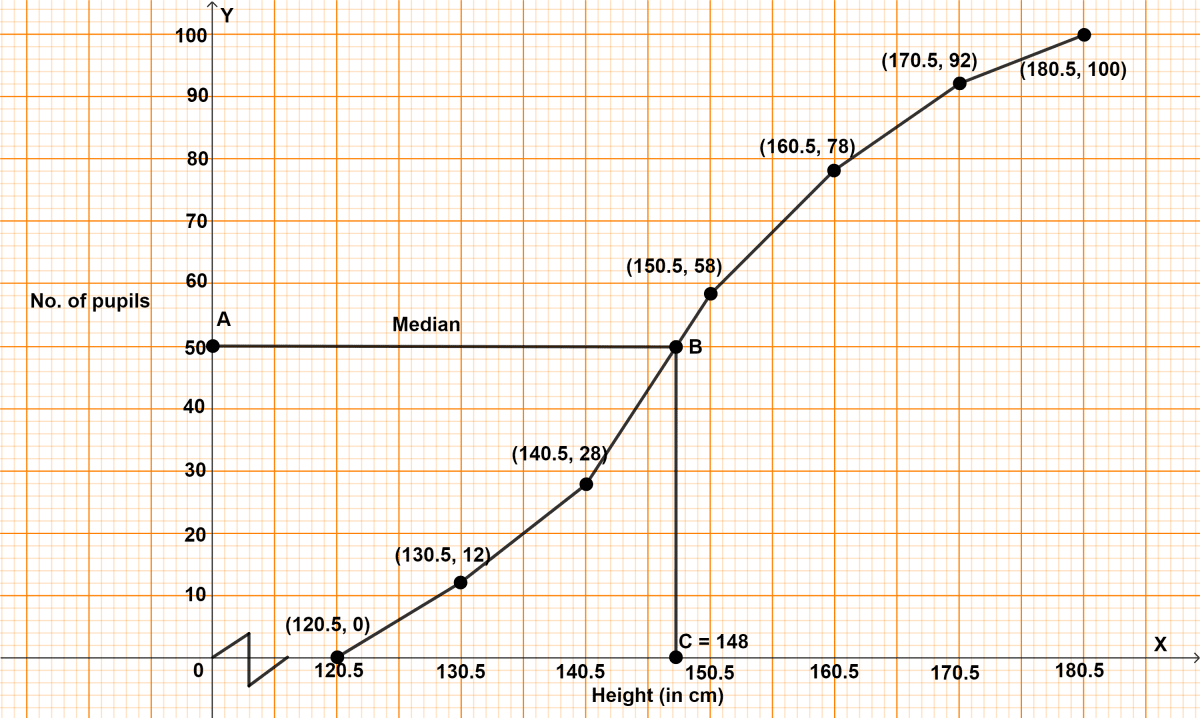
From graph, C = 148 cm
Hence, median = 148 cm.
Answered By
9 Likes
Related Questions
The weight of 60 boys are given in the following distribution table :
Weight (kg) No. of boys 37 10 38 14 39 18 40 12 41 6 Find :
(i) Median
(ii) Lower quartile
(iii) Upper quartile
(iv) Inter quartile range.
From the following cumulative frequency table draw ogive and then use it to find :
(i) Median
(ii) Lower quartile
(iii) Upper quartile
Marks (less than) Cumulative frequency 10 5 20 24 30 37 40 40 50 42 60 48 70 70 80 77 90 79 100 80 Find the mode of following data, using a histogram :
Class Frequency 0 - 10 5 10 - 20 12 20 - 30 20 30 - 40 9 40 - 50 4 The following table shows the expenditure of 60 boys on books. Find the mode of their expenditure.
Expenditure (₹) No. of students 20 - 25 4 25 - 30 7 30 - 35 23 35 - 40 18 40 - 45 6 45 - 50 2