Mathematics
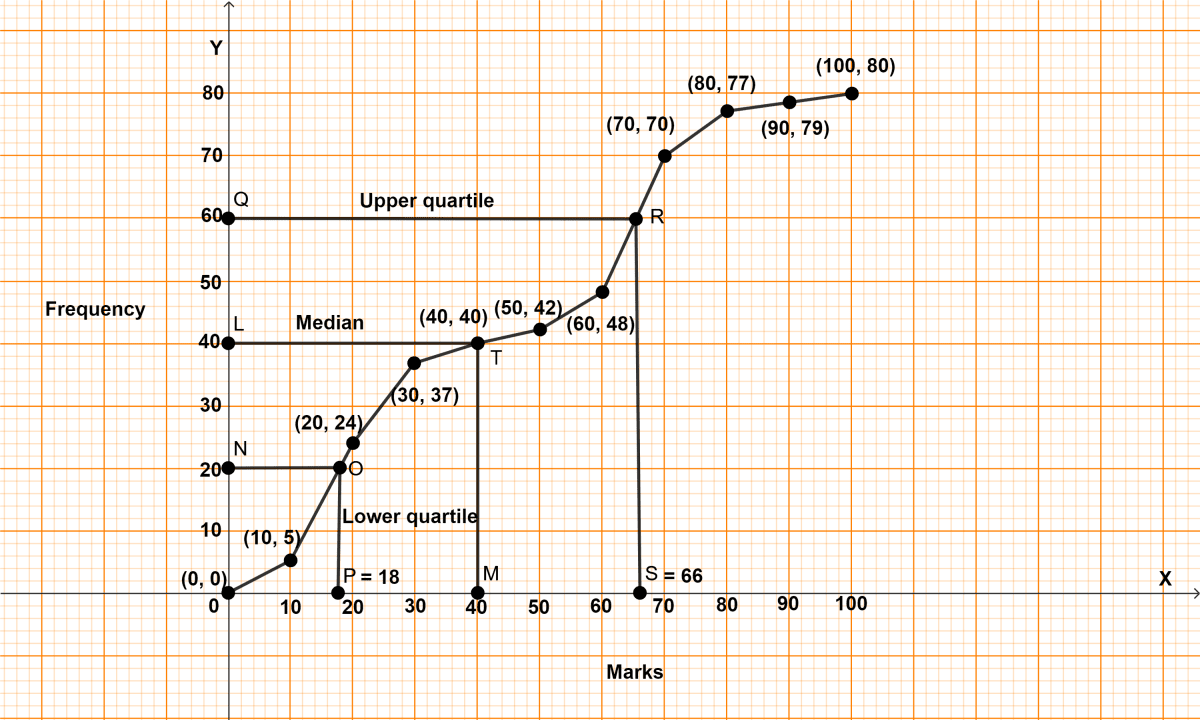
From the following cumulative frequency table draw ogive and then use it to find :
(i) Median
(ii) Lower quartile
(iii) Upper quartile
| Marks (less than) | Cumulative frequency |
|---|---|
| 10 | 5 |
| 20 | 24 |
| 30 | 37 |
| 40 | 40 |
| 50 | 42 |
| 60 | 48 |
| 70 | 70 |
| 80 | 77 |
| 90 | 79 |
| 100 | 80 |
Measures of Central Tendency
30 Likes
Answer
Cumulative frequency distribution table :
| Marks | Cumulative frequency |
|---|---|
| 0 - 10 | 5 |
| 10 - 20 | 24 |
| 20 - 30 | 37 |
| 30 - 40 | 40 |
| 40 - 50 | 42 |
| 50 - 60 | 48 |
| 60 - 70 | 70 |
| 70 - 80 | 77 |
| 80 - 90 | 79 |
| 90 - 100 | 80 |
Here, n = 80, which is even.
By formula,
Median = th term
= = 40th term.
Lower quartile = th term
= = 20th term.
Upper quartile = th term
= = 60th term.
Steps of construction of ogive :
Take 1 cm = 10 units on x-axis.
Take 1 cm = 10 units on y-axis.
Plot the point (0, 0), as ogive always starts on x-axis representing the lower limit of the first class.
Plot the points (10, 5), (20, 24), (30, 37), (40, 40), (50, 42), (60, 48), (70, 70), (80, 77), (90, 79) and (100, 80).
Join the points by a free hand curve.
Draw a line parallel to x-axis from point L (frequency) = 40, touching the graph at point T. From point T draw a line parallel to y-axis touching x-axis at point M.
Draw a line parallel to x-axis from point N (frequency) = 20, touching the graph at point O. From point O draw a line parallel to y-axis touching x-axis at point P.
Draw a line parallel to x-axis from point Q (frequency) = 60, touching the graph at point R. From point R draw a line parallel to y-axis touching x-axis at point S.

(i) From graph, M = 40
Hence, median = 40.
(ii) From graph, P = 18
Hence, lower quartile = 18.
(iii) From graph, S = 66
Hence, upper quartile = 66.
Answered By
9 Likes
Related Questions
The marks obtained by 19 students of a class are given below :
27, 36, 22, 31, 25, 26, 33, 24, 37, 32, 29, 28, 36, 35, 27, 26, 32, 35 and 28. Find:
(i) Median
(ii) lower quartile
(iii) Upper quartile
(iv) Inter-quartile range
The weight of 60 boys are given in the following distribution table :
Weight (kg) No. of boys 37 10 38 14 39 18 40 12 41 6 Find :
(i) Median
(ii) Lower quartile
(iii) Upper quartile
(iv) Inter quartile range.
In a school, 100 pupils have heights as tabulated below :
Height (in cm) No. of pupils 121 - 130 12 131 - 140 16 141 - 150 30 151 - 160 20 161 - 170 14 171 - 180 8 Find the median height by drawing an ogive.
Find the mode of following data, using a histogram :
Class Frequency 0 - 10 5 10 - 20 12 20 - 30 20 30 - 40 9 40 - 50 4