Mathematics
In a class of 90 students, the marks obtained in a weekly test were as under :
| Marks | No. of students |
|---|---|
| 16 - 20 | 4 |
| 21 - 25 | 12 |
| 26 - 30 | 18 |
| 31 - 35 | 26 |
| 36 - 40 | 14 |
| 41 - 45 | 10 |
| 46 - 50 | 6 |
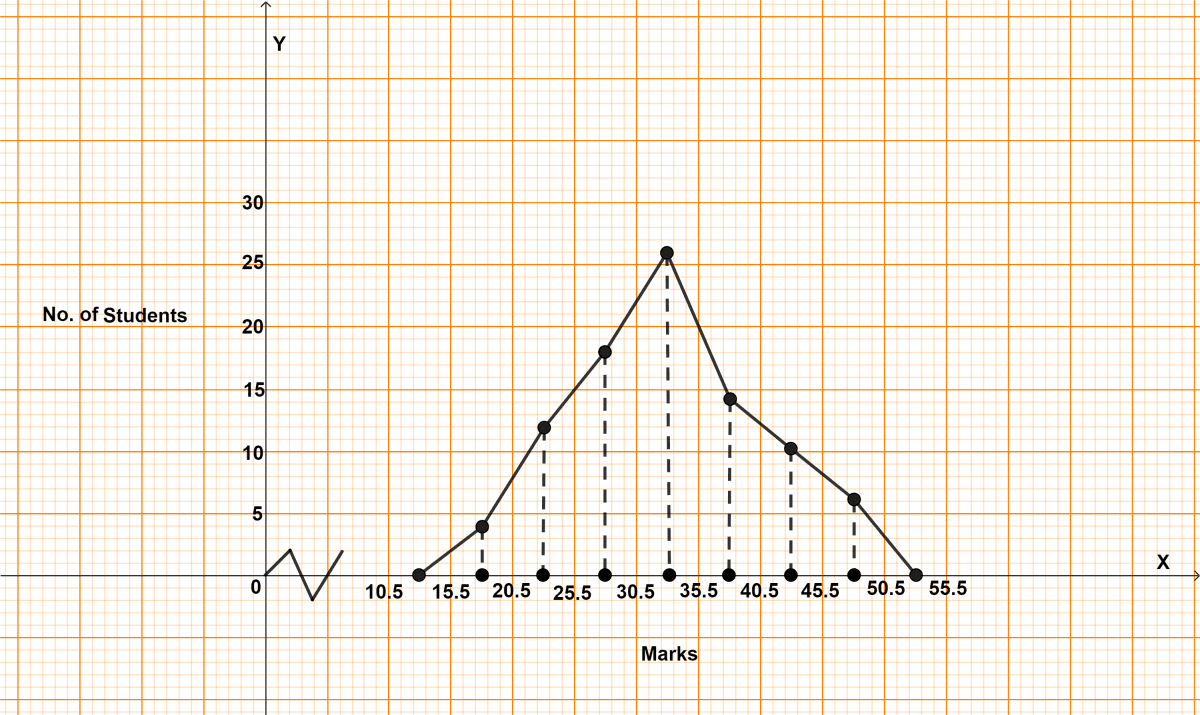
Draw a frequency polygon for the above data.
Statistics
49 Likes
Answer
The following frequency distribution is discontinuous, to convert it into continuous frequency distribution,
Adjustment factor = (Lower limit of one class - Upper limit of previous class) / 2
=
= 0.5
Subtract the adjustment factor (0.5) from all the lower limits and add the adjustment factor (0.5) to all the upper limits.
Continuous frequency distribution for given data is :
| Classes before adjustment | Classes after adjustment | Class mark | Frequency |
|---|---|---|---|
| 16 - 20 | 15.5 - 20.5 | 18 | 4 |
| 21 - 25 | 20.5 - 25.5 | 23 | 12 |
| 26 - 30 | 25.5 - 30.5 | 28 | 18 |
| 31 - 35 | 30.5 - 35.5 | 33 | 26 |
| 36 - 40 | 35.5 - 40.5 | 38 | 14 |
| 41 - 45 | 40.5 - 45.5 | 43 | 10 |
| 46 - 50 | 45.5 - 50.5 | 48 | 6 |
Steps to draw frequency polygon :
Since, the scale on x-axis starts at 10.5, a kink is shown near the origin on x-axis to indicate that the graph is drawn to scale beginning at 10.5.
Take 1 cm along x-axis = 5 marks.
Take 1 cm along y-axis = 5 students.
Find the mid-points of class-intervals.
Find points corresponding to given frequencies of classes and the mid-points of class-intervals, and plot them.
Join consecutive points by line segments.
Join first end point with mid-point of class 10.5 - 15.5 with zero frequency and join the other end with mid-point of class 50.5 - 55.5 with zero frequency.
The required frequency polygon is shown alongside.

Answered By
27 Likes
Related Questions
Draw a frequency polygon for the following data :
Class intervals Frequency 40 - 50 15 50 - 60 28 60 - 70 45 70 - 80 32 80 - 90 41 90 - 100 18 In a class of 60 students, the marks obtained in a monthly test were as under :
Marks Students 10 - 20 10 20 - 30 25 30 - 40 12 40 - 50 08 50 - 60 05 In a city, the weekly observations made in a study on the cost of living index are given in the following table :
Cost of living index Number of weeks 140 - 150 5 150 - 160 10 160 - 170 20 170 - 180 9 180 - 190 6 190 - 200 2 Draw a frequency polygon for the data given above.
Construct a combined histogram and frequency polygon for the following data :
Weekly earnings (in rupees) No. of workers 150 - 165 8 165 - 180 14 180 - 195 22 195 - 210 12 210 - 225 15 225 - 240 6