Mathematics
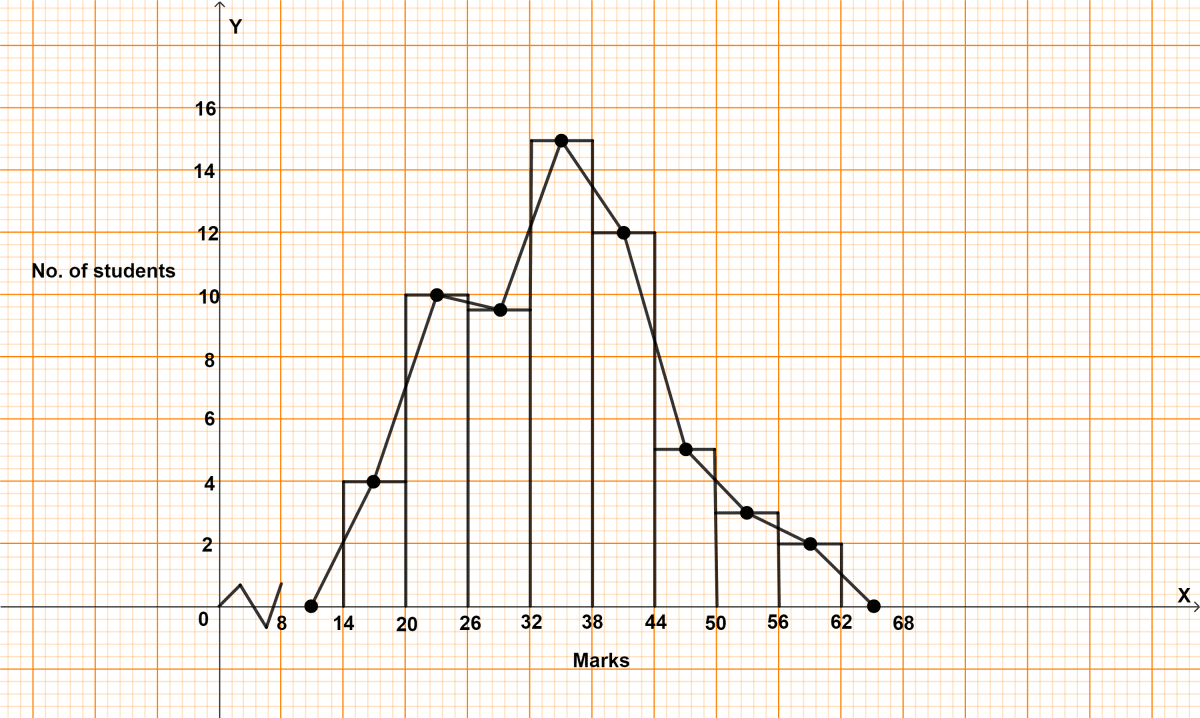
In a class of 60 students, the marks obtained in a surprise test were as under :
| Marks | No. of students |
|---|---|
| 14 - 20 | 4 |
| 20 - 26 | 10 |
| 26 - 32 | 9 |
| 32 - 38 | 15 |
| 38 - 44 | 12 |
| 44 - 50 | 5 |
| 50 - 56 | 3 |
| 56 - 62 | 2 |
Represent the above data by a histogram and a frequency polygon.
Answer
Steps of construction of histogram :
Since, the scale on x-axis starts at 8, a break (kink) is shown near the origin on x-axis to indicate that the graph is drawn to scale beginning at 8.
Take 1 cm along x-axis = 10 marks.
Take 1 cm along y-axis = 5 students.
Construct rectangles corresponding to the above continuous frequency distribution table.
The required histogram is shown in the adjoining figure.
Steps of construction of frequency polygon :
Mark the mid-points of upper bases of rectangles of the histogram.
Join the consecutive mid-points by line segments.
Join the first end point with the mid-point of class 8 - 14 with zero frequency, and join the other end point with the mid-point of class 62 - 68 wirh zero frequency.
The required frequency polygon is shown by thick line segments in the diagram.
Related Questions
The electricity bills (in rupees) of 40 houses in a locality are given below :
78 87 81 52 59 65 101 108 115 95
98 65 62 121 128 63 76 84 89 91
65 101 95 81 87 105 129 92 75 105
78 72 107 116 127 100 80 82 61 118
Form a frequency distribution table with a class size of 10. Also represent the above data with a histogram and frequency polygon.
Draw a histogram showing marks obtained by the students of a school in a Mathematics paper carrying 60 marks.
Marks Students 0 - 10 4 10 - 20 5 20 - 30 10 30 - 40 8 40 - 50 30 50 - 60 40 Construct a combined histogram and frequency polygon for the following distribution:
Classes Frequency 91 - 100 16 101 - 110 28 111 - 120 44 121 - 130 20 131 - 140 32 141 - 150 12 151 - 160 4 The following observations have been arranged in ascending order. If the median of the data is 63, find the value of x.
29, 32, 48, 50, x, x + 2, 72, 75, 87, 91.