
Mathematics
Construct a combined histogram and frequency polygon for the following distribution:
| Classes | Frequency |
|---|---|
| 91 - 100 | 16 |
| 101 - 110 | 28 |
| 111 - 120 | 44 |
| 121 - 130 | 20 |
| 131 - 140 | 32 |
| 141 - 150 | 12 |
| 151 - 160 | 4 |
Statistics
9 Likes
Answer
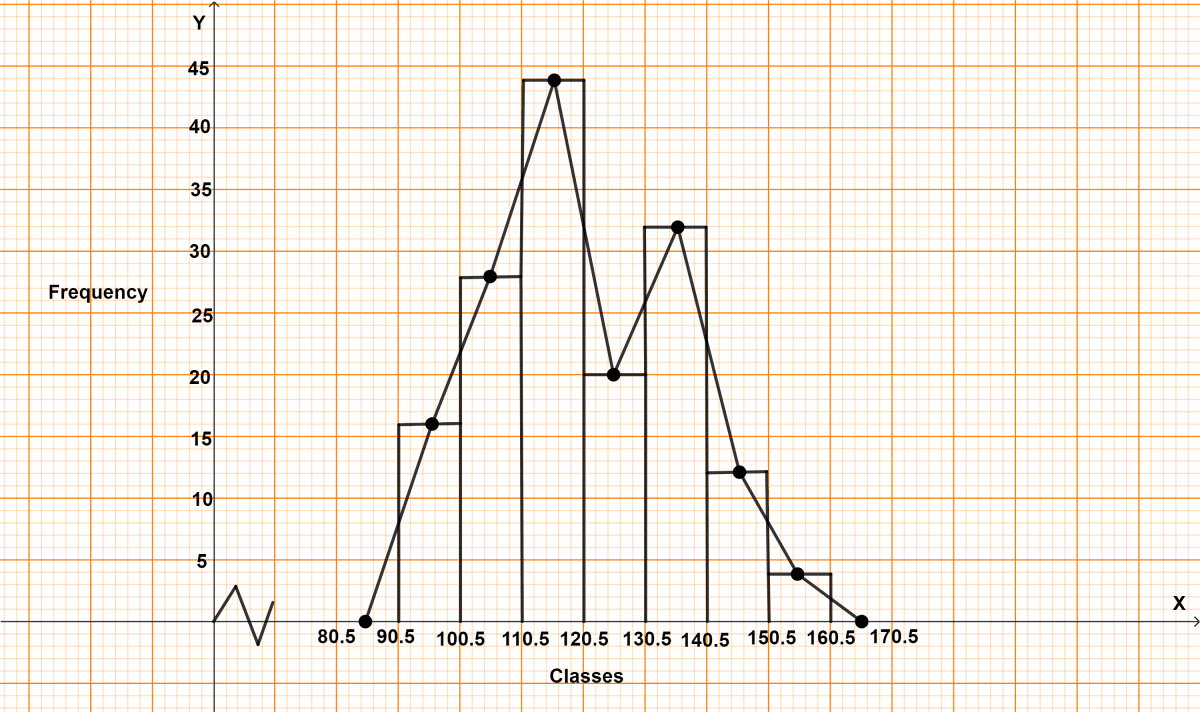
The following frequency distribution is discontinuous, to convert it into continuous frequency distribution,
Adjustment factor = (Lower limit of one class - Upper limit of previous class) / 2
=
= 0.5
Subtract the adjustment factor (0.5) from all the lower limits and add the adjustment factor (0.5) to all the upper limits.
Continuous frequency distribution for given data is :
| Classes before adjustment | Classes after adjustment | Class mark | Frequency |
|---|---|---|---|
| 91 - 100 | 90.5 - 100.5 | 95.5 | 16 |
| 101 - 110 | 100.5 - 110.5 | 105.5 | 28 |
| 111 - 120 | 110.5 - 120.5 | 115.5 | 44 |
| 121 - 130 | 120.5 - 130.5 | 125.5 | 20 |
| 131 - 140 | 130.5 - 140.5 | 135.5 | 32 |
| 141 - 150 | 140.5 - 150.5 | 145.5 | 12 |
| 151 - 160 | 150.5 - 160.5 | 155.5 | 4 |
Steps of construction of histogram :
Since, the scale on x-axis starts at 80.5, a break (kink) is shown near the origin on x-axis to indicate that the graph is drawn to scale beginning at 80.5
Take 1 cm along x-axis = 10 units.
Take 1 cm along y-axis = 5 units.
Construct rectangles corresponding to the above continuous frequency distribution table.
The required histogram is shown in the adjoining figure.
Steps of construction of frequency polygon :
Mark the mid-points of upper bases of rectangles of the histogram.
Join the consecutive mid-points by line segments.
Join the first end point with the mid-point of class 80.5 - 90.5 with zero frequency, and join the other end point with the mid-point of class 160.5 - 170.5 with zero frequency.
The required frequency polygon is shown by thick line segments in the diagram.
Answered By
5 Likes
Related Questions
Draw a histogram showing marks obtained by the students of a school in a Mathematics paper carrying 60 marks.
Marks Students 0 - 10 4 10 - 20 5 20 - 30 10 30 - 40 8 40 - 50 30 50 - 60 40 In a class of 60 students, the marks obtained in a surprise test were as under :
Marks No. of students 14 - 20 4 20 - 26 10 26 - 32 9 32 - 38 15 38 - 44 12 44 - 50 5 50 - 56 3 56 - 62 2 Represent the above data by a histogram and a frequency polygon.
The electricity bills (in rupees) of 40 houses in a locality are given below :
78 87 81 52 59 65 101 108 115 95
98 65 62 121 128 63 76 84 89 91
65 101 95 81 87 105 129 92 75 105
78 72 107 116 127 100 80 82 61 118
Form a frequency distribution table with a class size of 10. Also represent the above data with a histogram and frequency polygon.
The data given below represent the marks obtained by 35 students:
21 26 21 20 23 24 22 19 24
26 25 23 26 29 21 24 19 25
26 25 22 23 23 27 26 24 25
30 25 23 28 28 24 28 28
Taking class intervals 19 - 20, 21 - 22 etc., make a frequency distribution for the above data.
Construct a combined histogram and frequency polygon for the distribution.