
Physics
Figure below shows a velocity-time graph for a car starting from rest. The graph has three parts AB, BC and CD.
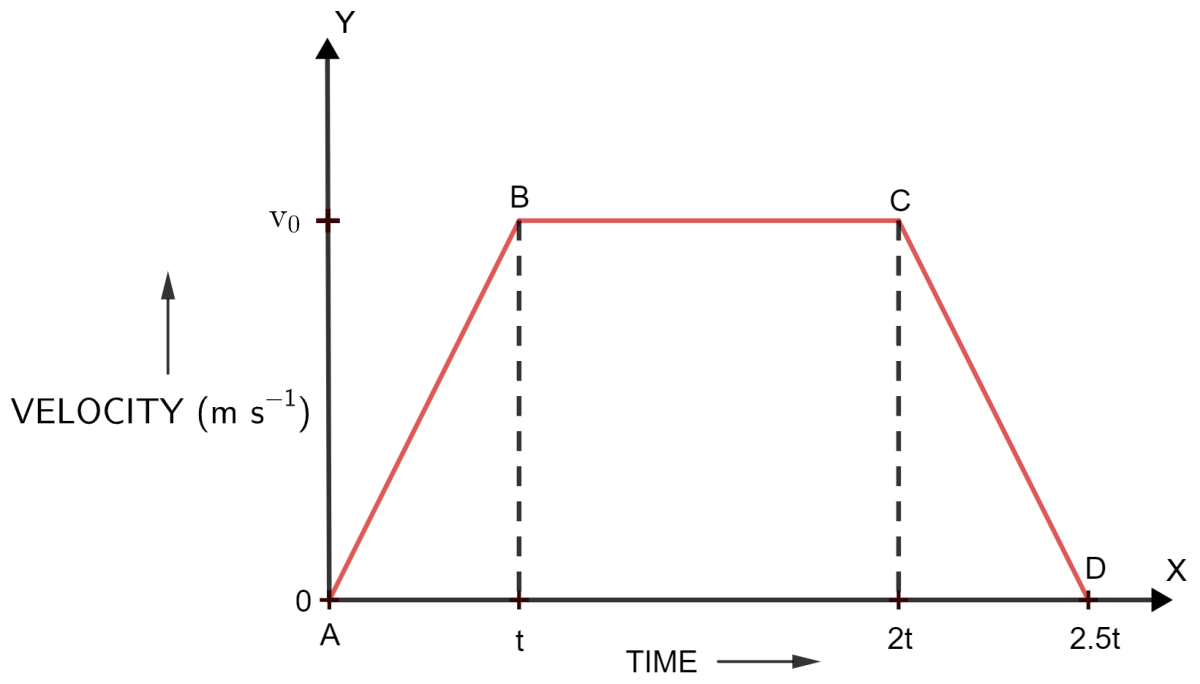
(i) State how is the distance travelled in any part determined from this graph.
(ii) Compare the distance travelled in part BC with the distance travelled in part AB.
(iii) Which part of graph shows motion with uniform (a) velocity (b) acceleration (c) retardation?
(iv) (a) Is the magnitude of acceleration higher or lower than that of retardation? Give a reason. (b) Compare the magnitude of acceleration and retardation.
Motion in One Dimension
45 Likes
Answer
(i) The distance travelled in any part of the graph can be obtained by finding the area enclosed by the graph in that part with the time axis.
(ii) Let E be the point on time axis (x axis) at time t and F be the point at time 2t.
When we observe the graph, we find,
Distance travelled in part BC = Area of rectangle EBCF
∴ Distance travelled in part BC = length x breadth
= (2t - t) x (v0 - 0)
= t x v0 …. [1]
Distance travelled in part AB = Area of triangle ABT
∴ Distance travelled in part AB = x base x height
= x (t - 0) x (v0 - 0)
= x t x v0 …. [2]
Comparing [1] and [2] we get,
Distance travelled in part BC : Distance travelled in part AB
Hence,
Distance travelled in part BC : Distance travelled in part AB = 2 : 1
(iii) The different parts of the graph are mentioned below:
(a) Uniform velocity is shown in part BC of the graph, as the velocity is constant with time.
(b) Uniform acceleration is shown in part AB of the graph, as the velocity is increasing with time.
(c) Uniform retardation is shown in part CD of the graph, as the velocity is decreasing with time.
(iv) (a) The magnitude of acceleration is lower, as slope of line AB is less than that of line CD.
(b) Acceleration in part AB = slope of AB
Retardation in part CD = slope of CD
Magnitude of acceleration : Magnitude of retardation = Slope of line AB : Slope of line CD
Hence, Magnitude of acceleration : Magnitude of retardation = 1 : 2
Answered By
30 Likes
Related Questions
A body at rest is made to fall from the top of a tower. Its displacement at different instants is given in the following table —
Time (in s) 0.1 0.2 0.3 0.4 0.5 0.6 Displacement (in m) 0.05 0.20 0.45 0.80 1.25 1.80 Draw a displacement-time graph and state whether the motion is uniform or non-uniform?
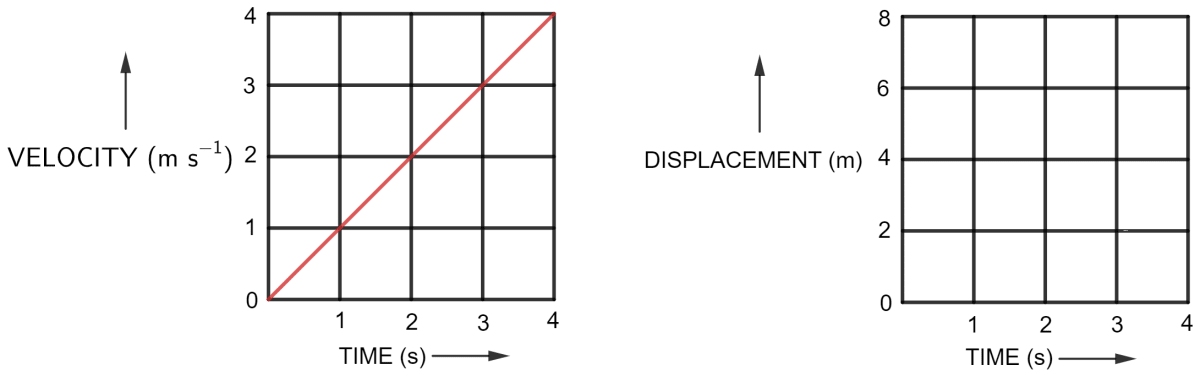
Figure shows the velocity-time graph for the motion of a body. Use it to find the displacement of the body at t = 1 s, 2 s, 3 s and 4 s, then draw the displacement-time graph for it on figure (b).
The velocity-time graph of a moving body is given below in figure
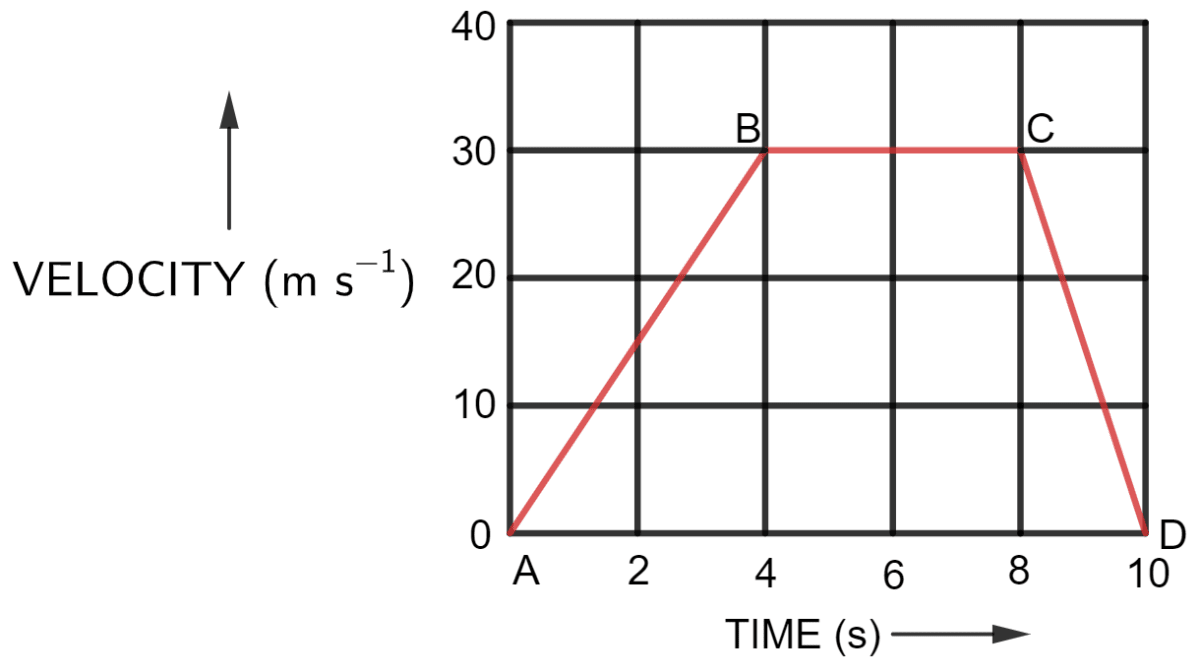
Find —
(i) The acceleration in parts AB, BC and CD.
(ii) Displacement in each part AB, BC, CD, and
(iii) Total displacement.
A ball moves on a smooth floor in a straight line with a uniform velocity 10 m s-1 for 6 s. At t = 6 s, the ball hits a wall and comes back along the same line to the starting point with same speed. Draw the velocity-time graph and use it to find the total distance travelled by the ball and its displacement.