
Mathematics
Using the data given below construct the cumulative frequency table and draw the ogive. From the ogive, determine the median.
| Marks | No. of students |
|---|---|
| 0 - 10 | 3 |
| 10 - 20 | 8 |
| 20 - 30 | 12 |
| 30 - 40 | 14 |
| 40 - 50 | 10 |
| 50 - 60 | 6 |
| 60 - 70 | 5 |
| 70 - 80 | 2 |
Measures of Central Tendency
23 Likes
Answer
- The cumulative frequency table for the given continuous distribution is :
| Marks | No. of students | Cumulative frequency |
|---|---|---|
| 0 - 10 | 3 | 3 |
| 10 - 20 | 8 | 11 |
| 20 - 30 | 12 | 23 |
| 30 - 40 | 14 | 37 |
| 40 - 50 | 10 | 47 |
| 50 - 60 | 6 | 53 |
| 60 - 70 | 5 | 58 |
| 70 - 80 | 2 | 60 |
Take 1 cm along x-axis = 10 marks
Take 1 cm along y-axis = 10 (students)
Plot the points (10, 3), (20, 11), (30, 23), (40, 37), (50, 47), (60, 53), (70, 58) and (80, 60) representing upper class limits and the respective cumulative frequencies.
Also plot the point representing lower limit of the first class i.e. 0 - 10.
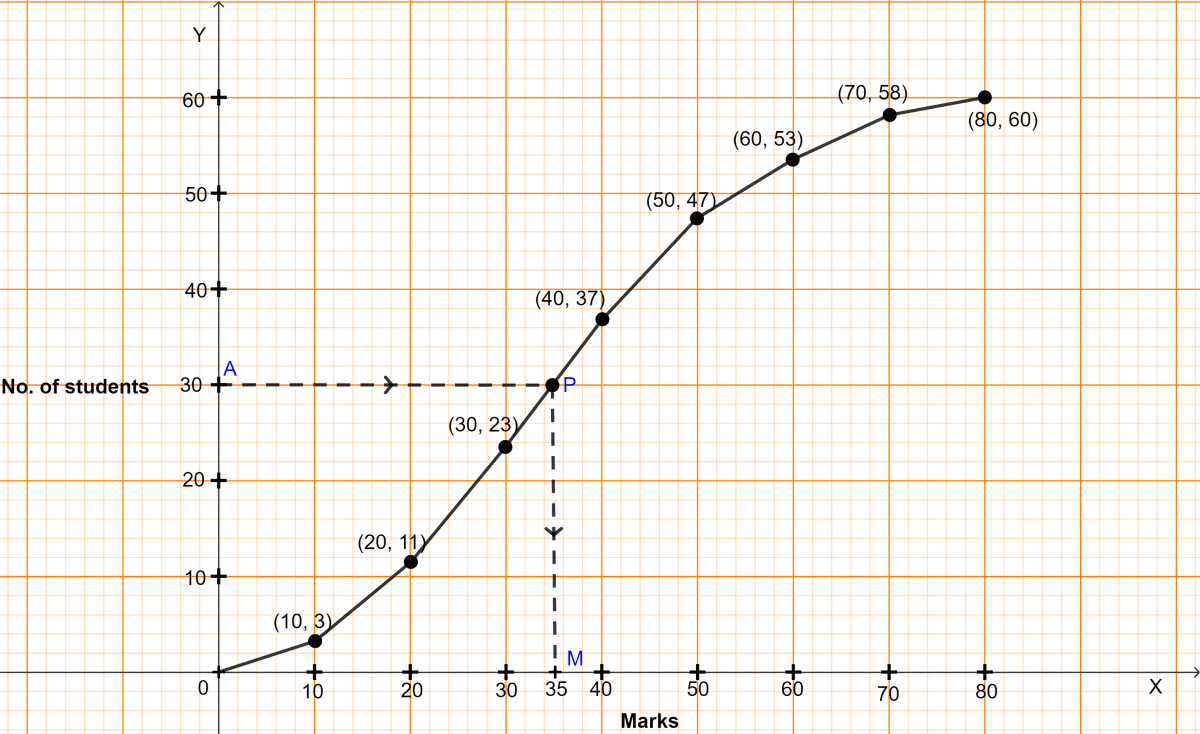
- Join these points by a freehand drawing.
The required ogive is shown in figure above.
Here, n (no. of students) = 60.
To find the median :
Let A be the point on y-axis representing frequency = = 30.
Through A draw a horizontal line to meet the ogive at P. Through P, draw a vertical line to meet the x-axis at M. The abscissa of the point M represents 35 marks.
Hence, the required median = 35 marks.
Answered By
10 Likes
Related Questions
Draw an ogive for the following frequency distribution :
Class-intervals Frequency 1 - 10 3 11 - 20 5 21 - 30 8 31 - 40 7 41 - 50 6 51 - 60 2 Draw a cumulative frequency curve for the following data :
Marks obtained No. of students 24 - 29 1 29 - 34 2 34 - 39 5 39 - 44 6 44 - 49 4 49 - 54 3 54 - 59 2 The weight of 50 workers is given below :
Weight (in kg) No. of workers 50 - 60 4 60 - 70 7 70 - 80 11 80 - 90 14 90 - 100 6 100 - 110 5 110 - 120 3 Draw an ogive of the given distribution using a graph sheet. Take 2 cm = 10 kg on one axis and 2 cm = 5 workers along the other axis. Use a graph to estimate the following :
(i) the upper and lower quartiles.
(ii) if weighing 95 kg and above is considered overweight find the number of workers who are overweight.
The table shows the distribution of scores obtained by 160 shooters in a shooting competition. Use a graph sheet and draw an ogive for the distribution.
(Take 2 cm = 10 scores on the x-axis and 2 cm = 20 shooters on the y-axis)
Scores No. of shooters 0 - 10 9 10 - 20 13 20 - 30 20 30 - 40 26 40 - 50 30 50 - 60 22 60 - 70 15 70 - 80 10 80 - 90 8 90 - 100 7 Use your graph to estimate the following :
(i) The median.
(ii) The inter quartile range.
(iii) The number of shooters who obtained a score of more than 85%.