
Physics
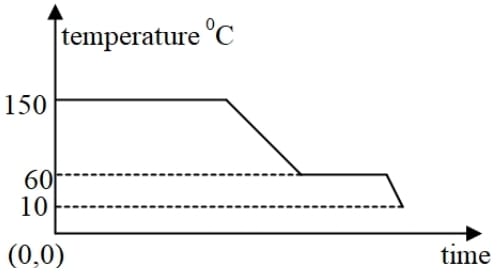
The diagram below shows a cooling curve for a substance:
(a) State the temperatures at which the substance condenses.
(b) The temperature range in which the substance is in liquid state.
(c) Why do we prefer ice to ice-cold water for cooling a drink?
Calorimetry
ICSE Sp 2024
95 Likes
Answer
(a) Substance condenses at 150° C
(b) 150 to 60°C
(c) 1 g of ice at 0° C takes 336 J of heat energy from the drink to melt into water at 0° C. Thus, the drink liberates an additional 336 J of heat energy to 1 g ice at 0° C than to 1 g ice-cold water at 0° C. Therefore, cooling produced by 1 g ice at 0° C is much more than that by 1 g water at 0° C.
Answered By
61 Likes
Related Questions
(a) Copy and complete the following nuclear reaction.
22286Rn ⟶ 21884Po + _—X
(b) What will be the effect on the radiation X, emitted in the above reaction when it is allowed to pass through an electric field?
Observe the given circuit diagram and answer the questions that follow:
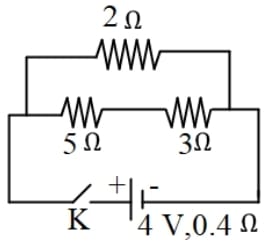
(a) Calculate the resistance of the circuit when the key K completes the circuit.
(b) Calculate the current through 3Ω resistance when the circuit is complete.
What mass of ice at 0°C added to 2.1 kg water, will cool it down from 75°C to 25°C?
Given: Specific heat capacity of water = 4.2 Jg-1 C-1
Specific latent heat of ice = 336 Jg-1
A magnet is released along the axis of a copper coil as shown in the diagram.
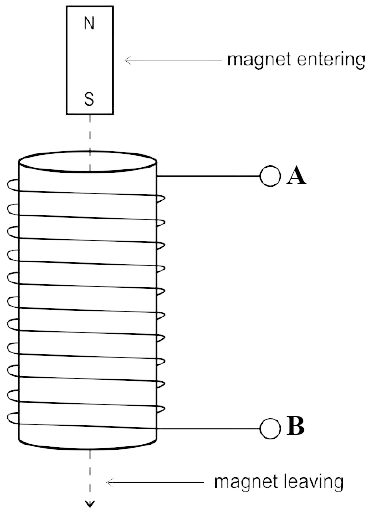
(a) State the polarity at the top end of the coil when the magnet leaves the coil.
(b) The direction of the current is from A to B when magnet enters the coil. What will be the direction of the current when the magnet leaves the coil.
(c) Name the law which can be used to determine the direction of the induced current in the coil?
(d) State one way to increase the magnitude of the induced current in the coil?