
Physics
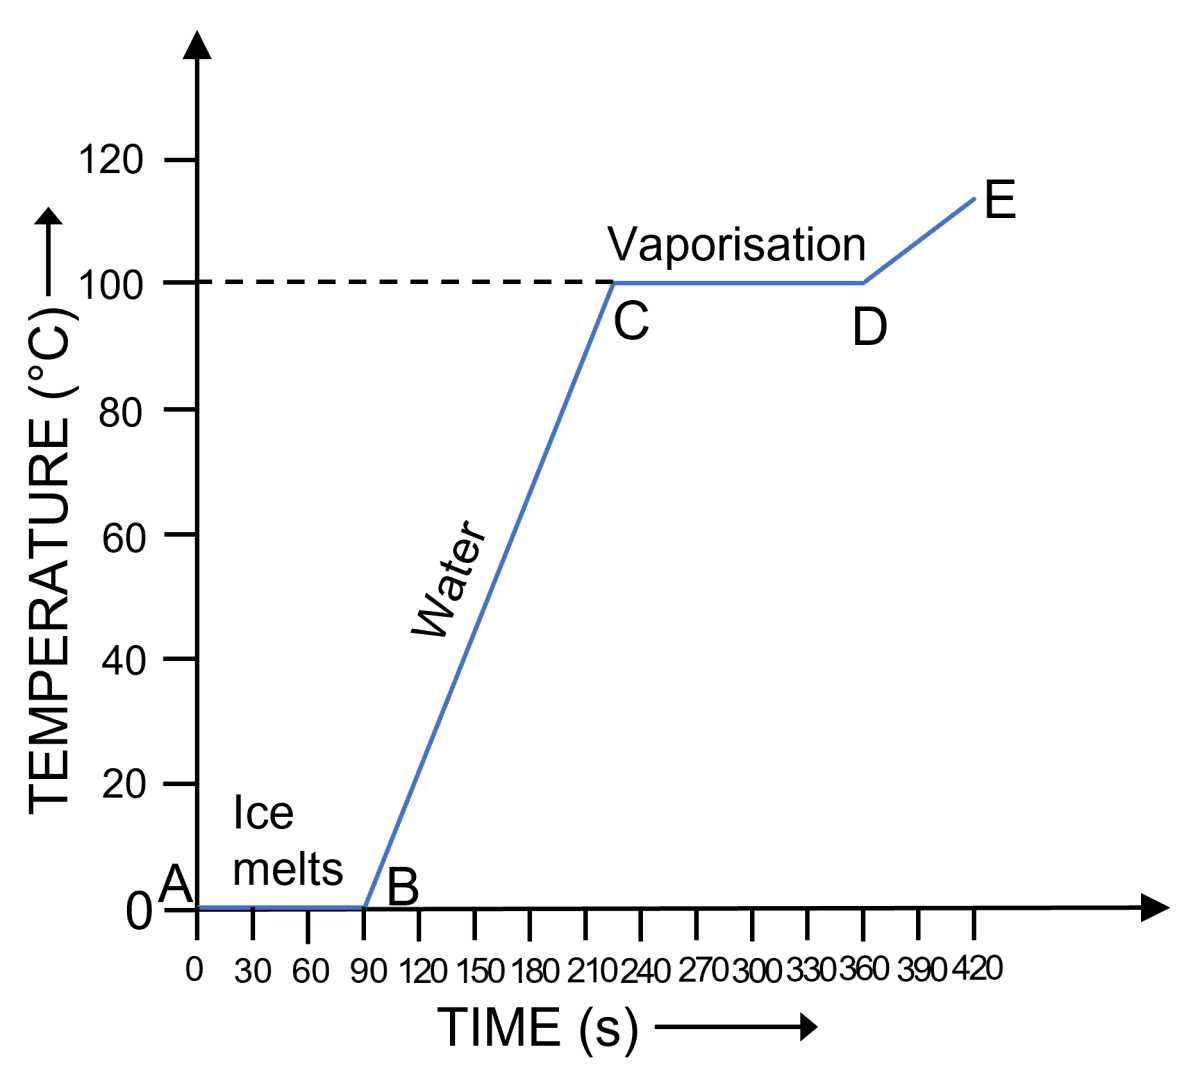
Some ice is heated at a constant rate, and it's temperature is recorded after every few seconds, till steam is formed at 100°C. Draw a temperature time graph to represent the change. Label the two phase changes in your graph.
Calorimetry
ICSE 2016
14 Likes
Answer
Temperature-time graph representing the change of ice to steam is shown below:
Answered By
10 Likes
Related Questions
(i) An effort is applied on the bigger wheel of a gear having 32 teeth. It is used to turn a wheel of 8 teeth. Where is it used?
(ii) A pulley system has three pulleys. A load of 120 N is overcome by applying an effort of 50 N. Calculate the Mechanical Advantage and Efficiency of this system.
(i) What is the principle of method of mixtures?
(ii) What is the other name given to it?
(iii) Name the law on which the principle is based.
A copper vessel of mass 100 g contains 150 g of water at 50 °C. How much ice is needed to cool it to 5 °C?
Given : Specific heat capacity of copper = 0.4 J g-1 ⁰C-1
Specific heat capacity of water = 4.2 J g-1 ⁰C-1
Specific latent heat of fusion of ice = 336 J g-1
(i) Write a relationship between angle of incidence and angle of refraction for a given pair of media.
(ii) When a ray of light enters from one medium to another having different optical densities it bends. Why does this phenomenon occur?
(iii) Write one condition where it does not bend when entering a medium of different optical density.