
Physics
Figure shows the displacement of a body at different times.
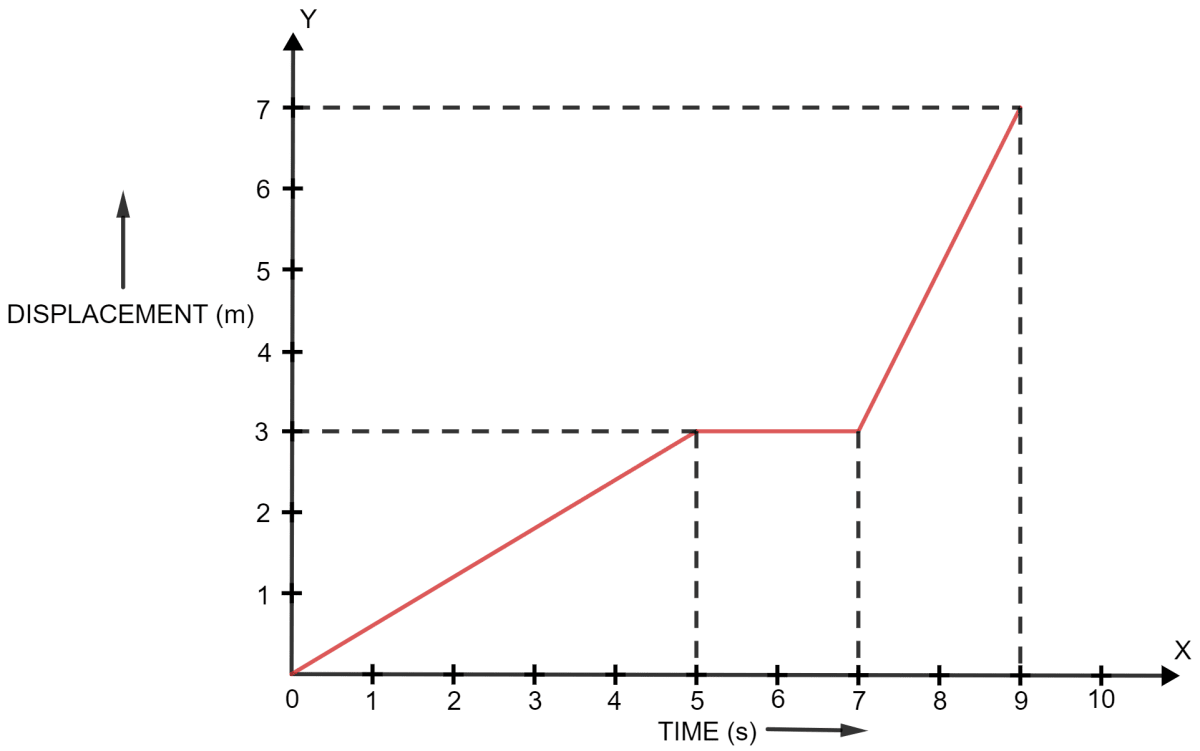
(a) Calculate the velocity of the body as it moves for time interval
(i) 0 to 5 s,
(ii) 5 s to 7 s and
(iii) 7 s to 9 s.
(b) Calculate the average velocity during the time interval 5 s to 9 s.
[ Hint — From 5 s to 9 s, displacement = 7 m - 3 m = 4 m ]
Motion in One Dimension
62 Likes
Answer
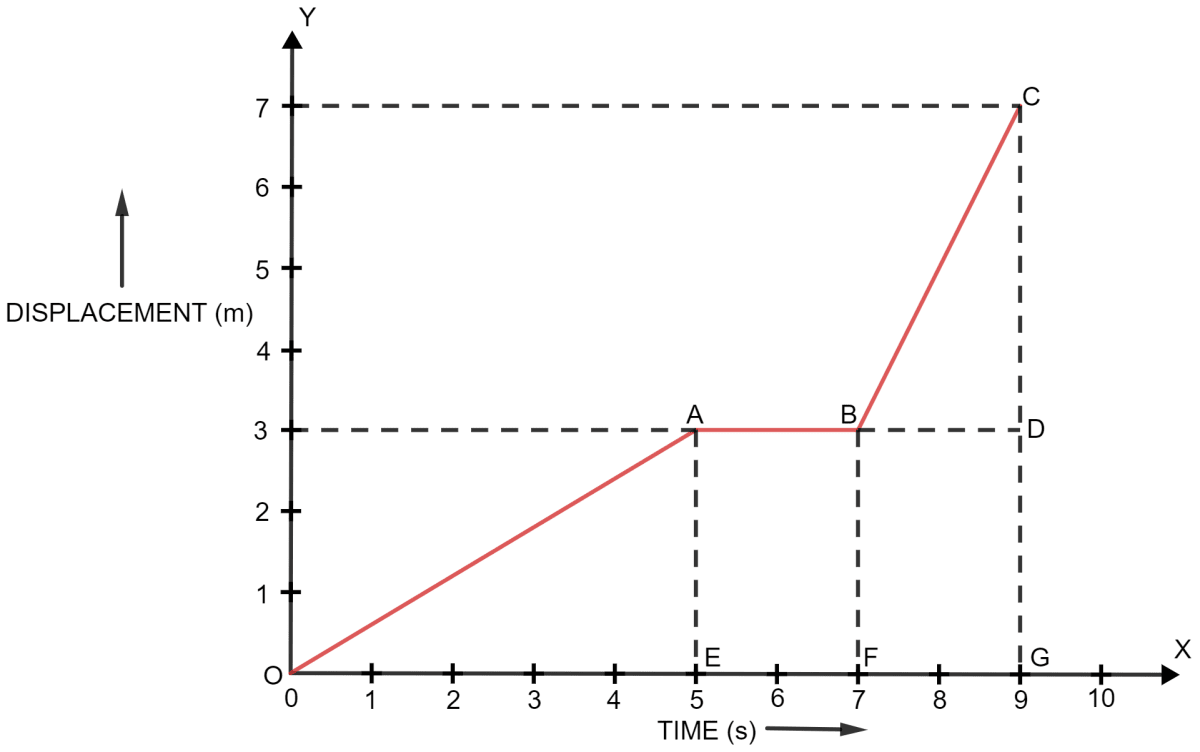
Below is the displacement-time graph of the body with the different points marked:
(a) As we know,
(i) At t = 0 to 5 s
Velocity = Slope of straight line OA
Hence, velocity at t = 0 to 5 s = 0.6 m s-1
(ii) At t = 5 to 7 s
In this part we observe that there is no change in Y axis, (i.e. displacement is zero so the body is stationary).
Hence, velocity at t = 5 to 7 s = 0 m s-1
(iii) At t = 7 s to 9 s
Velocity = Slope of straight line BC
Hence, velocity at t = 7 s to 9 s = 2 m s-1
(b) As we know,
Substituting the values from the graph we get,
Hence, average velocity of the car is 1 ms-1.
Answered By
44 Likes
Related Questions
Following table gives the displacement of a car at different instants of time.
Time (s) 0 1 2 3 4 Displacement (m) 0 5 10 15 20 (a) Draw the displacement-time sketch and find the average velocity of car.
(b) What will be the displacement of car at (i) 2.5 s and (ii) 4.5 s ?
A body is moving in a straight line and its displacement at various instants of time is given in the following table —
Time (s) 0 1 2 3 4 5 6 7 Displacement (m) 2 6 12 12 12 18 22 24 Plot displacement-time graph and calculate —
(i) Total distance travelled in interval 1 s to 5 s,
(ii) Average velocity in time interval 1 s to 5 s.
From the displacement-time graph of a cyclist, given in figure, find —
(i) The average velocity in the first 4 s,
(ii) The displacement from the initial position at the end of 10 s
(iii) The time after which he reaches the starting point.
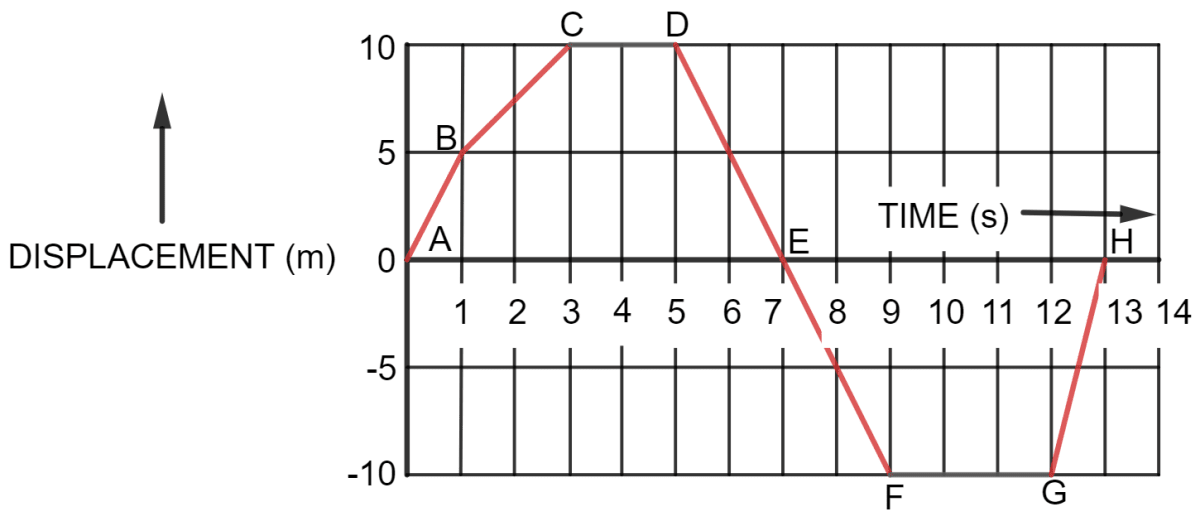
Figure ahead represents the displacement-time sketch of motion of two cars A and B.
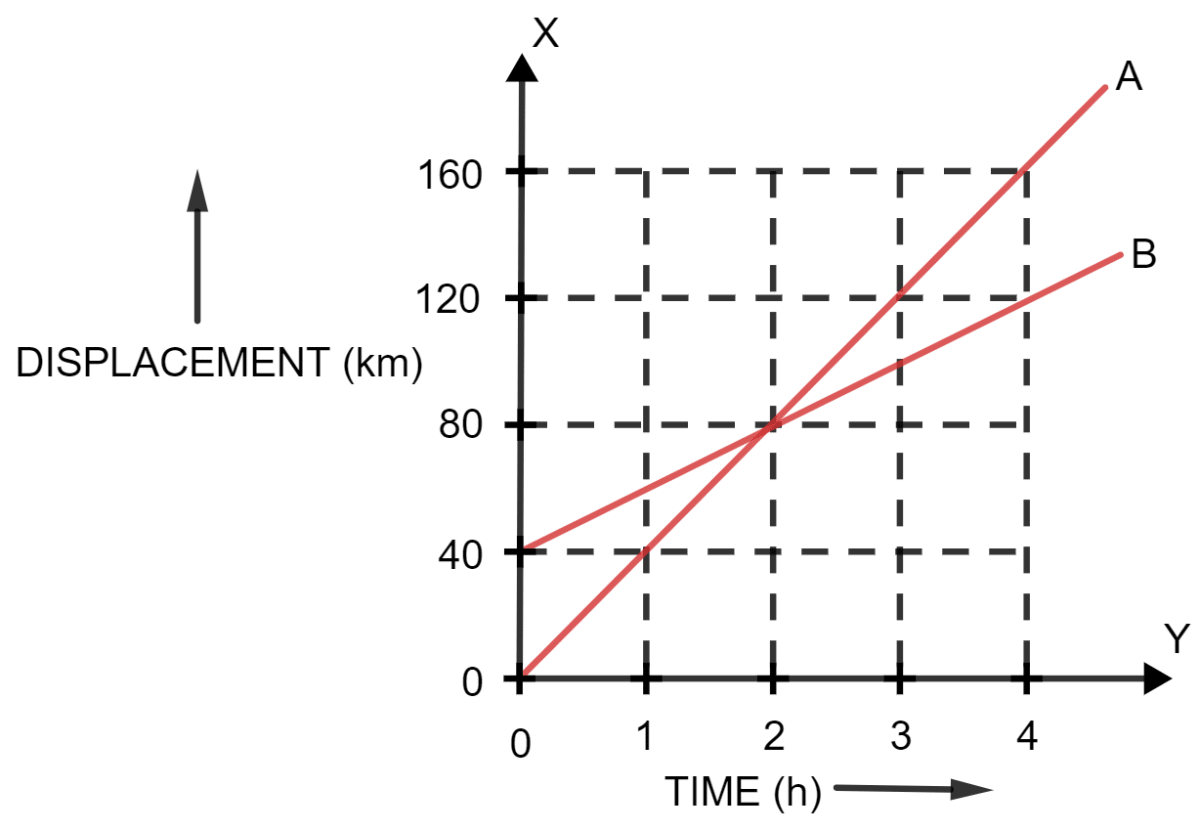
Find —
(i) The distance by which the car B was initially ahead of car A.
(ii) The velocities of car A and car B
(iii) The time in which car A catches car B
(iv) The distance from start when the car A will catch the car B