
Physics
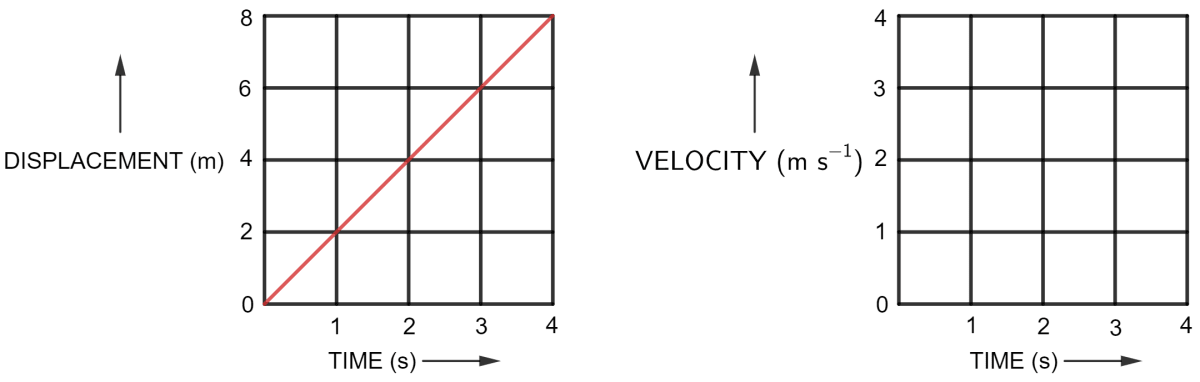
Figure (a) shows the displacement-time graph for the motion of a body. Use it to calculate the velocity of body at t = 1 s, 2 s and 3 s, then draw the velocity-time graph for it in Figure (b).
Motion in One Dimension
110 Likes
Answer
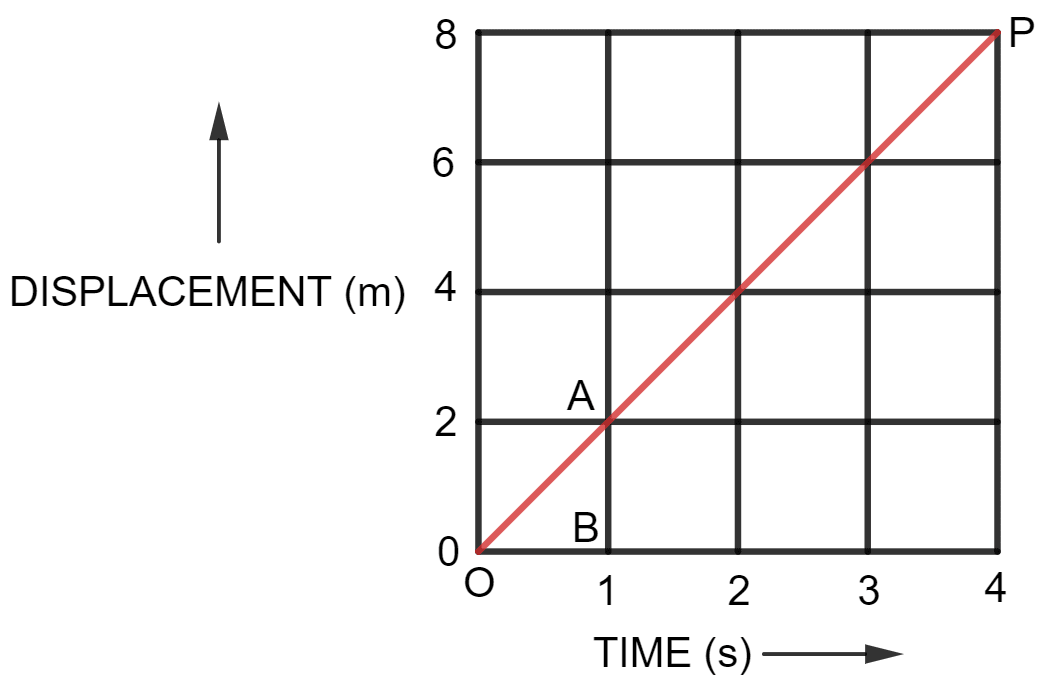
We observe from the given displacement time graph above, that the slope is a straight line inclined with time axis, so the body is moving with uniform velocity. Hence, the velocity will be same at t = 1 s, 2 s and 3 s.
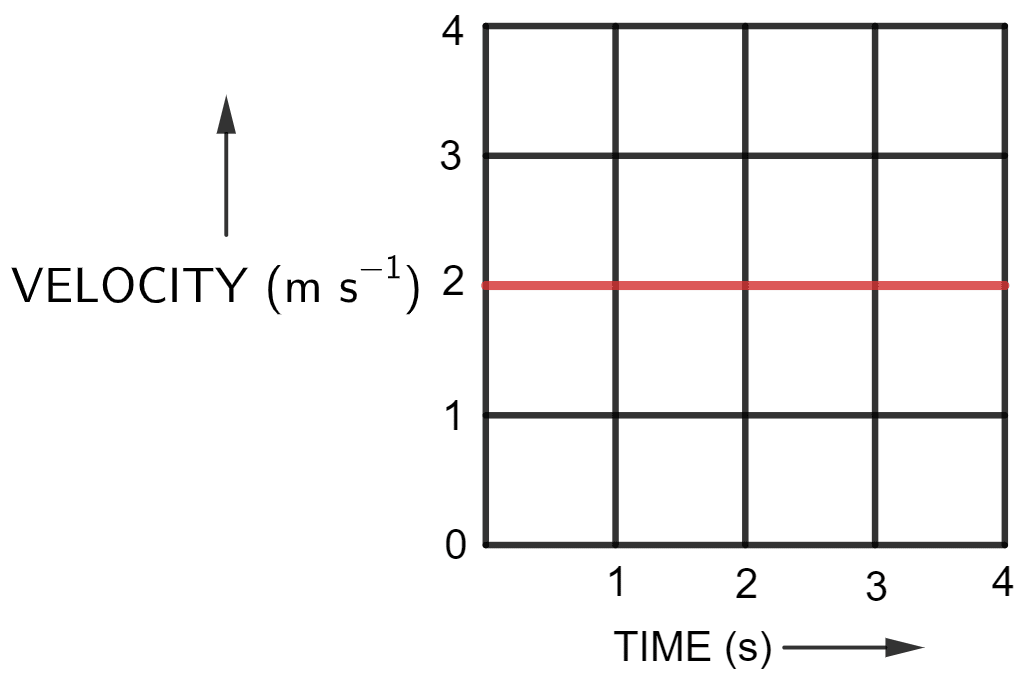
Hence, velocity at t = 1 s, 2 s and 3 s is equal to 2 m s-1
Velocity-time graph for the motion of a body is given below:
Answered By
75 Likes
Related Questions
Draw the velocity-time graph for a body moving with —
(a) uniform velocity,
(b) uniform acceleration.
and give one example of each and also calculate the displacement and acceleration.
Draw the acceleration-time graph for a body moving with :
(a) Uniform velocity
(b) Free falling body
and give an example of each.
Following table gives the displacement of a car at different instants of time.
Time (s) 0 1 2 3 4 Displacement (m) 0 5 10 15 20 (a) Draw the displacement-time sketch and find the average velocity of car.
(b) What will be the displacement of car at (i) 2.5 s and (ii) 4.5 s ?
A body is moving in a straight line and its displacement at various instants of time is given in the following table —
Time (s) 0 1 2 3 4 5 6 7 Displacement (m) 2 6 12 12 12 18 22 24 Plot displacement-time graph and calculate —
(i) Total distance travelled in interval 1 s to 5 s,
(ii) Average velocity in time interval 1 s to 5 s.