
Mathematics
Draw the graph of line 4x - y = 5. Use this graph to find :
(i) x1, the value of x when y = 3.
(ii) y1, the value of y, when x = 3.
Coordinate Geometry
4 Likes
Answer
Step 1:
Give at least three suitable values to the variable x and find the corresponding values of y.
Let x = 4, then 4 (4) - y = 5 ⇒ y = 11
Let x = 3.5, then 4 3.5 - y = 5 ⇒ y = 9
Let x = 1, then 4 1 - y = 5 ⇒ y = -1
Step 2:
Make a table (as given below) for the different pairs of the values of x and y:
| x | 4 | 3.5 | 3 |
|---|---|---|---|
| y | 11 | 9 | 7 |
Step 3:
Plot the points, from the table, on a graph paper and then draw a straight line AB passing through the points plotted on the graph.
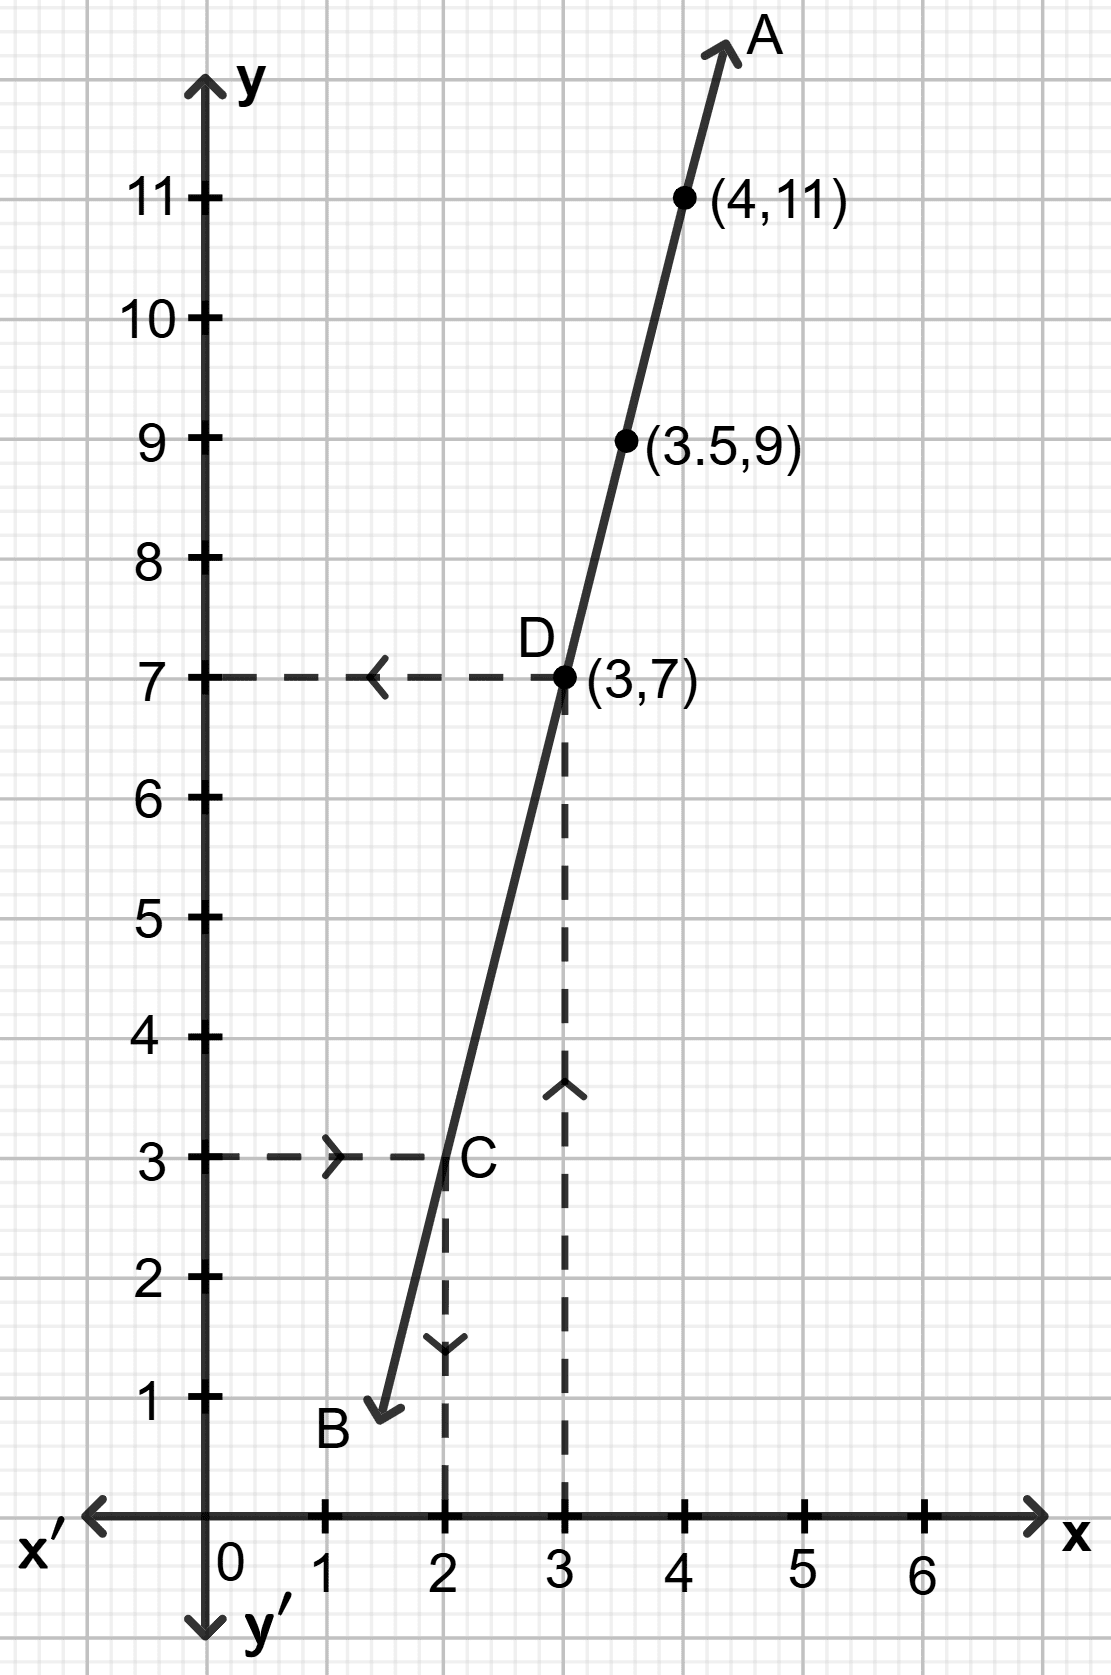
(i) To find x1, the value of x, when y = 3:
Through the point y = 3, draw a horizontal straight line which meets the line AB at point C.
Through point C, draw a vertical line which meets the x-axis at x = 2.
Hence, the value of x, when y = 3 is 2 , i.e, x1 = 2.
(ii) To find y1, the value of y, when x = 3:
Through the point x = 3, draw a vertical line which meets the line AB at point D.
Through point D, draw a horizontal line which meets the y-axis at y = 7.
Hence, the value of y, when x = 3 is 7 , i.e, y1 = 7.
Answered By
1 Like
Related Questions
Draw the graph of equation . Use the graph drawn to find :
(i) x1, the value of x, when y = 10
(ii) y1, the value of y, when x = 8.
Use the graphical method to show that the straight lines given by the equations and pass through the same point.
Draw the graph of line x + y = 5. Use the graph paper drawn to find the inclination and the y-intercept of the line.
Draw the graph of line 2x + y = 5.