Mathematics
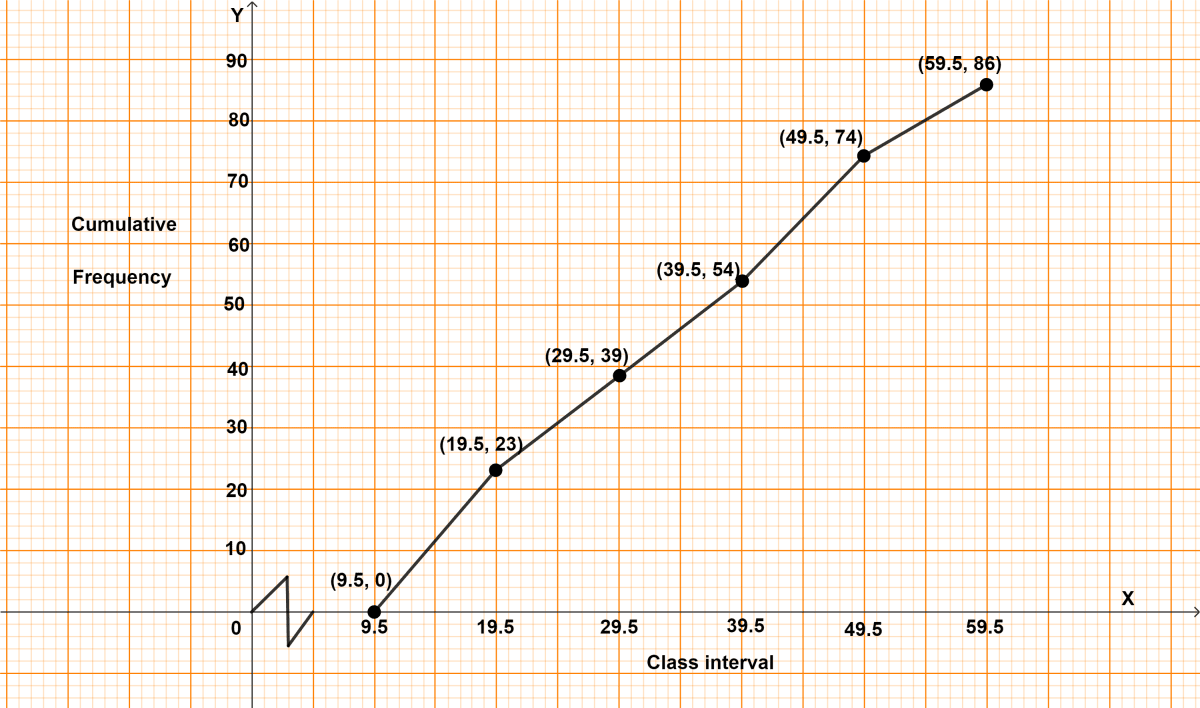
Draw a cumulative frequency curve (ogive) for the following distributions :
| Class interval | Frequency |
|---|---|
| 10 - 19 | 23 |
| 20 - 29 | 16 |
| 30 - 39 | 15 |
| 40 - 49 | 20 |
| 50 - 59 | 12 |
Statistics
21 Likes
Answer
The above distribution is discontinuous converting into continuous distribution, we get :
Adjustment factor = (Lower limit of one class - Upper limit of previous class) / 2
=
= 0.5
Subtract the adjustment factor (0.5) from all the lower limits and add the adjustment factor (0.5) to all the upper limits.
| Classes before adjustment | Classes after adjustment | Frequency | Cumulative frequency |
|---|---|---|---|
| 10 - 19 | 9.5 - 19.5 | 23 | 23 |
| 20 - 29 | 19.5 - 29.5 | 16 | 39 (23 + 16) |
| 30 - 39 | 29.5 - 39.5 | 15 | 54 (39 + 15) |
| 40 - 49 | 39.5 - 49.5 | 20 | 74 (54 + 20) |
| 50 - 59 | 49.5 - 59.5 | 12 | 86 (74 + 12) |
Steps of construction of ogive :
Since, the scale on x-axis starts at 9.5, a break (kink) is shown near the origin on x-axis to indicate that the graph is drawn to scale beginning at 9.5.
Take 2 cm = 10 units along x-axis.
Take 1 cm = 10 units along y-axis.
Ogive always starts from a point on x-axis representing the lower limit of the first class. Mark point (9.5, 0).
Take upper class limits along x-axis and corresponding cumulative frequencies along y-axis, mark the points (19.5, 23), (29.5, 39), (39.5, 54), (49.5, 74) and (59.5, 86).
Join the points marked by a free hand curve.
The required ogive is shown in the below figure:

Answered By
16 Likes
Related Questions
Draw histograms for the following frequency distributions :
Class mark Frequency 16 8 24 12 32 15 40 18 48 25 56 19 64 10 Draw a cumulative frequency curve (ogive) for the following distributions :
Class Interval Frequency 10 - 15 10 15 - 20 15 20 - 25 17 25 - 30 12 30 - 35 10 35 - 40 8 Draw an ogive for the following distribution :
Marks obtained No. of students less than 10 8 less than 20 25 less than 30 38 less than 40 50 less than 50 67 Draw an ogive for the following distribution :
Age in years (less than) Cumulative frequency 10 0 20 17 30 32 40 37 50 53 60 58 70 65