
Mathematics
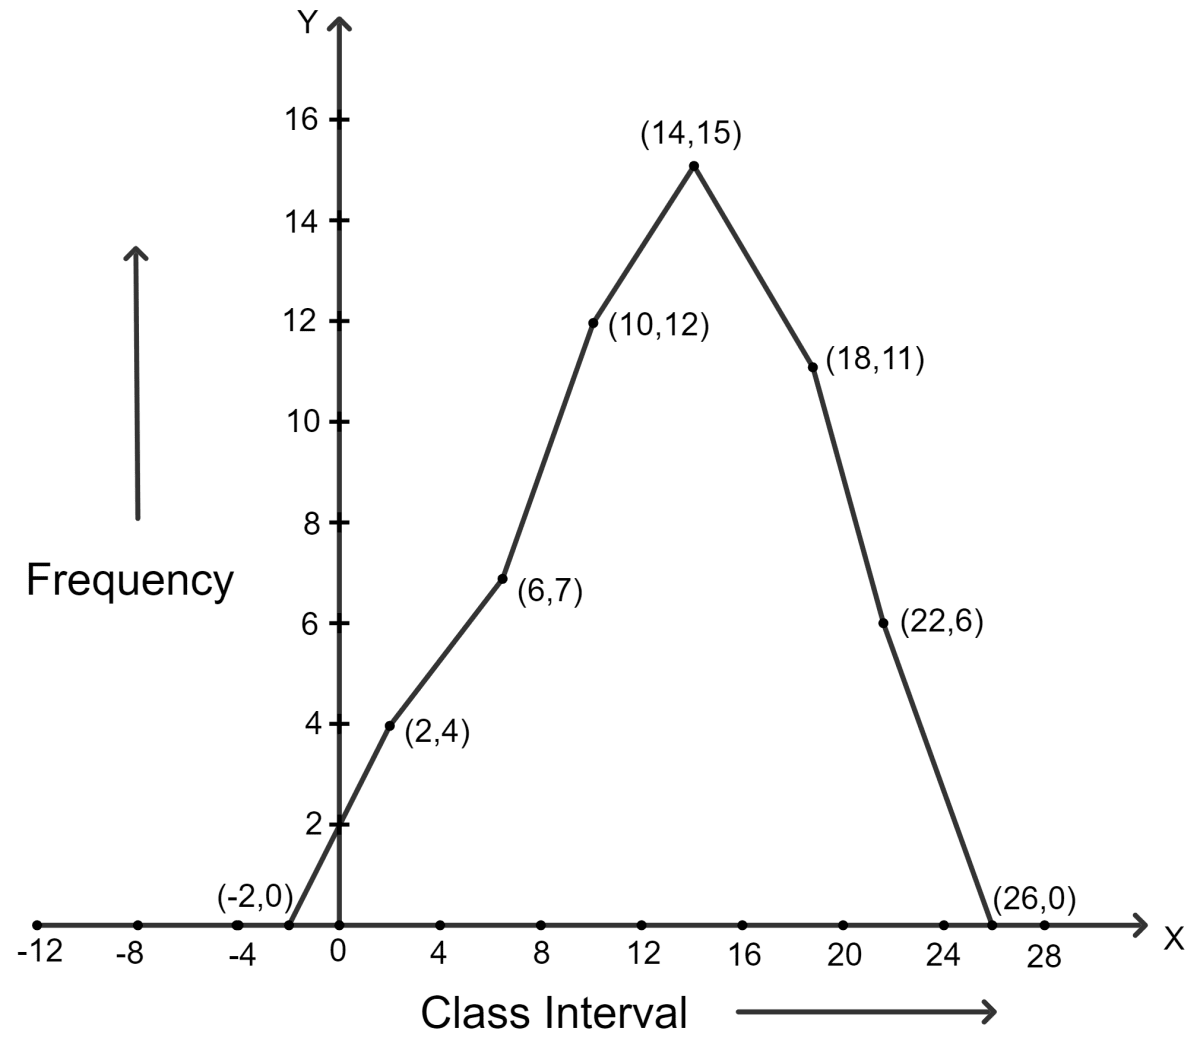
Construct a frequency polygon for the following distribution :
| Class-intervals | 0 - 4 | 4 - 8 | 8 - 12 | 12 - 16 | 16 - 20 | 20 - 24 |
|---|---|---|---|---|---|---|
| Frequency | 4 | 7 | 10 | 15 | 11 | 6 |
Statistics
49 Likes
Answer
| Class intervals | Frequency | Class mark |
|---|---|---|
| -4 - 0 | 0 | |
| 0 - 4 | 4 | |
| 4 - 8 | 7 | |
| 8 - 12 | 12 | |
| 12 - 16 | 15 | |
| 16 - 20 | 11 | |
| 20 - 24 | 6 | |
| 24 - 28 | 0 |
Steps:
Find the class-mark (mid-value) of each given class-interval.
Class-mark = mid-value =
On a graph paper, mark class-marks along x-axis and frequencies along y-axis.
On this graph paper, mark points taking values of class-marks along x-axis and the values of their corresponding frequencies along y-axis.
Draw line segments joining the consecutive points marked in step (3) above.
Answered By
32 Likes
Related Questions
Construct a cumulative frequency distribution table from the frequency table given below :
(i)
Class Interval Frequency 0 - 8 9 8 - 16 13 16 - 24 12 24 - 32 7 32 - 40 15 (ii)
Class Interval Frequency 1 - 10 12 11 - 20 18 21 - 30 23 31 - 40 15 41 - 50 10 Construct a frequency distribution table from the following cumulative frequency distribution:
(i)
Class Interval Cumulative Frequency 10 - 19 8 20 - 29 19 30 - 39 23 40 - 49 30 (ii)
C.I. C.F. 5 - 10 18 10 - 15 30 15 - 20 46 20 - 25 73 25 - 30 90 Construct a combined histogram and frequency polygon for the following frequency distribution :
Class-intervals 10 - 20 20 - 30 30 - 40 40 - 50 50 - 60 Frequency 3 5 6 4 2 Construct a frequency polygon for the following data :
Class-intervals 10 - 14 15 - 19 20 - 24 25 - 29 30 - 34 Frequency 5 8 12 9 4