Computer Applications
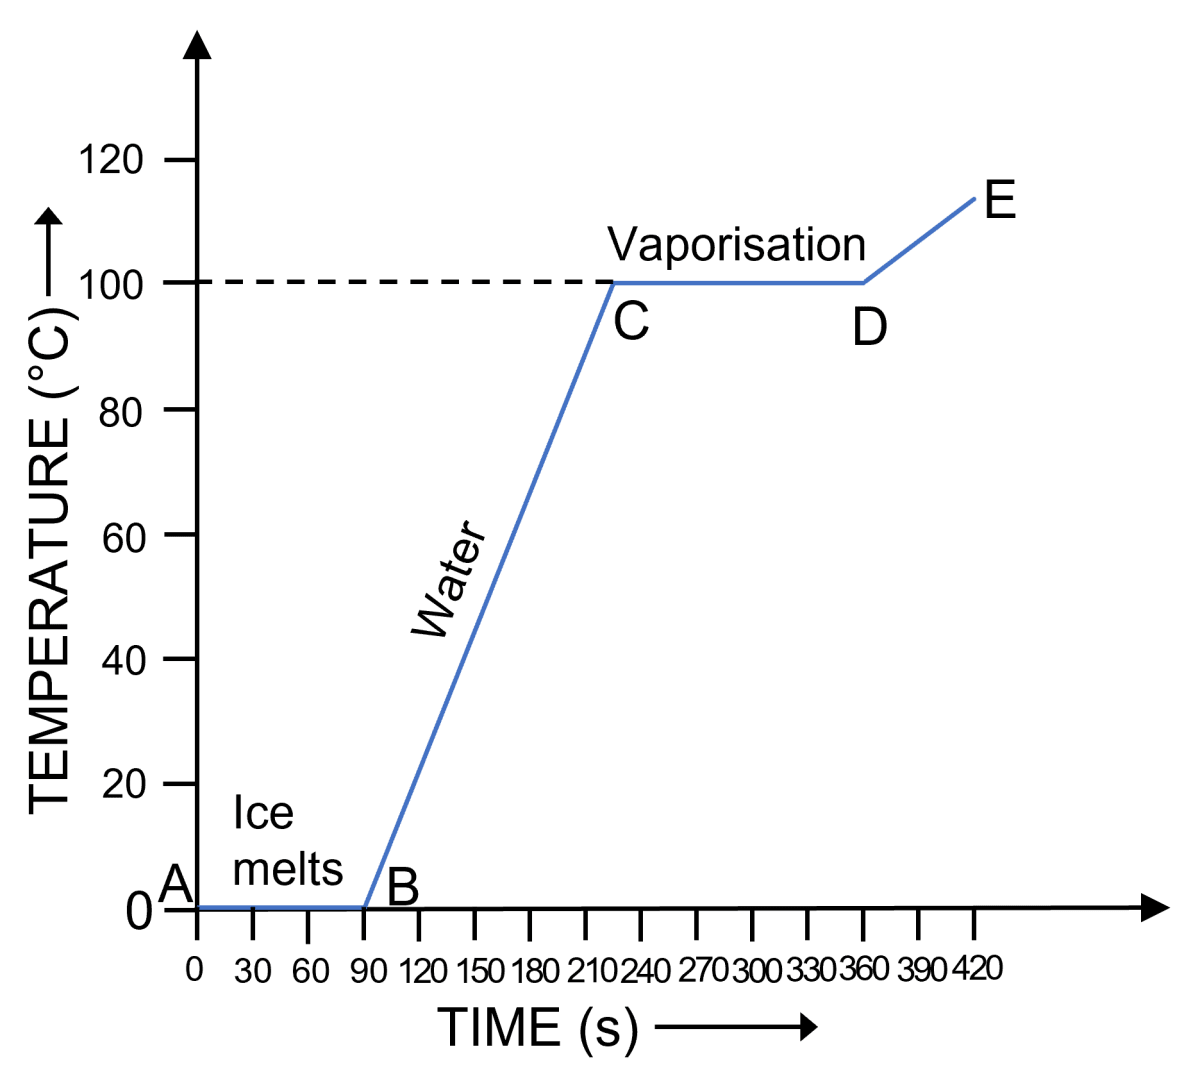
1 kg of ice at 0°C is heated at a constant rate and it's temperature is recorded every 30 s till steam is formed at 100°C. Draw a temperature-time graph to represent the change of phases.
Related Questions
The melting point of naphthalene is 80° C and the room temperature is 25°. A sample of liquid naphthalene at 90° is cooled down to room temperature. Draw a temperature-time graph to represent this cooling. On the graph mark the region which corresponds to the freezing process.
Explain the following —
(a) The surroundings become pleasantly warm when water in a lake starts freezing in cold countries.
(b) The heat supplied to a substance during it's change of state, does not cause any rise in it's temperature.
Explain the terms boiling and boiling point. How is the volume of water affected when it boils at 100°C.
The diagram below shows the change of phases of a substance on a temperature-time graph on heating the substances at a constant rate.
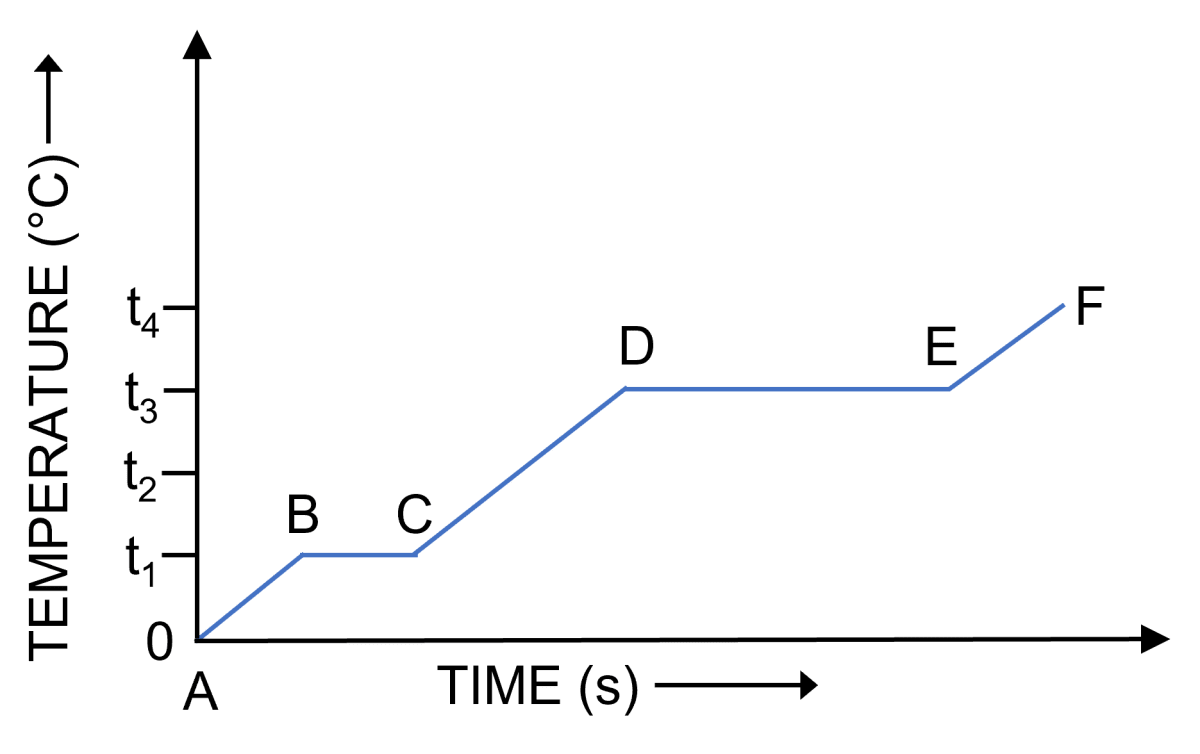
(a) What do parts AB, BC, CD and DE represent?
(b) What is the melting point of the substance?
(c) What is the boiling point of the substance?